Climatology Data API
The Climatology Data API provides access to historical climatology data from the ERA5-Land dataset. It's designed for anyone needing detailed insights into what are the typical climatic variables averaged over several years at specific locations.
Climatology refers to the study of climate, analyzed statistically over long periods. This API focuses on climatological data, providing a comprehensive view of historical climate patterns and is presented as monthly averages.
- Variables Available
- Geographic Coverage
- Time Periods
Variable Selection
Choose the climatological variable for analysis:
See variables
| Full Variable Name | Description | Short Variable |
|---|---|---|
| 2m Dewpoint Temperature | Temperature at which air reaches saturation (dew point) at 2 meters above the ground | d2m |
| 2m Temperature | Ambient air temperature at 2 meters above the ground | t2m |
| 10m U Component of Wind | East-West (longitudinal) wind component at 10 meters above the ground | u10 |
| 10m V Component of Wind | North-South (latitudinal) wind component at 10 meters above the ground | v10 |
| Snow Cover | The fraction of land area covered by snow | snowc |
| Snow Density | The density of snow on the ground | rsn |
| Snow Depth | The depth of snow accumulated on the ground | sde |
| Snow Depth Water Equivalent | The amount of water contained within the snowpack | sd |
| Snow Fall | The amount of snowfall | sf |
| Snow Melt | The amount of snow melting over a given area and time period | smlt |
| Surface Pressure | Atmospheric pressure at the Earth's surface | sp |
| Surface Runoff | The flow of water occurring on the ground surface when excess rain can't be absorbed | sro |
| Total Evaporation | The total amount of water evaporated from the Earth's surface | e |
| Total Precipitation | The total amount of precipitation, including rain, snow, hail, etc. | tp |
Geographic Coordinates
This endpoint is offered globally.
Time Periods
The climatology is calculated as between January 1950 and December 2022. We average monthly, and offer our climatology as month-wise timesteps.
Methodology
For a comprehensive understanding of our methodology, refer to the detailed breakdown below:
Each climatological variable in our dataset - from temperature metrics like '2m Temperature' to precipitation indicators like 'Total Precipitation' - provides specific insights into different aspects of the Earth's climate system. Understanding these variables is key to interpreting long-term climatic trends accurately.
Data Collection and Analysis
-
Monthly Averages: Our approach involves calculating monthly average values for each climatological variable. This provides a clear picture of typical conditions for each month, smoothing out short-term variations to focus on longer-term trends.
-
Historical Span: The data spans from 1950 to 2022, offering a broad historical perspective. This period allows for an analysis of climatic changes and trends over several decades.
Statistical Approach
-
Long-Term Averaging: By averaging data over each month across the entire period (1950-2022), we obtain a stable and reliable representation of climatic behaviors for each variable.
-
Data Consistency: Ensuring consistency in data collection and processing techniques throughout the entire historical period is crucial for accurate trend analysis.
Interpretation of Climatological Data
- It's important to consider climatic variability and potential anomalies in the data, especially when analyzing long-term trends. Be aware of the limitations of historical data and the potential for gaps or inconsistencies in early records.
Caution should be taken when talking about reanalysis data, as unlike direct historical observations, reanalysis data represents estimates of past weather conditions, reconstructed using models that combine past weather observations with modern forecasting techniques. This method offers a consistent and comprehensive data set that can be used to understand climatic changes over time. As a result, many scientists use reanalysis in place of observations.
Inputs
The API accepts the following parameters:
variable: The climatological variable for analysis, where you can use the short variables for analysis, corresponding to short variables in the table above.latitude&longitude: The geographical coordinates in decimal degrees where the analysis is desired. Latitude ranges from -90 to 90, and longitude from -180 to 180. NOTE: please check our available geographical region page here to ensure the index is available in your desired region.
Interactive Endpoint
You can access and interact with the API endpoints using our API Endpoint Directory.
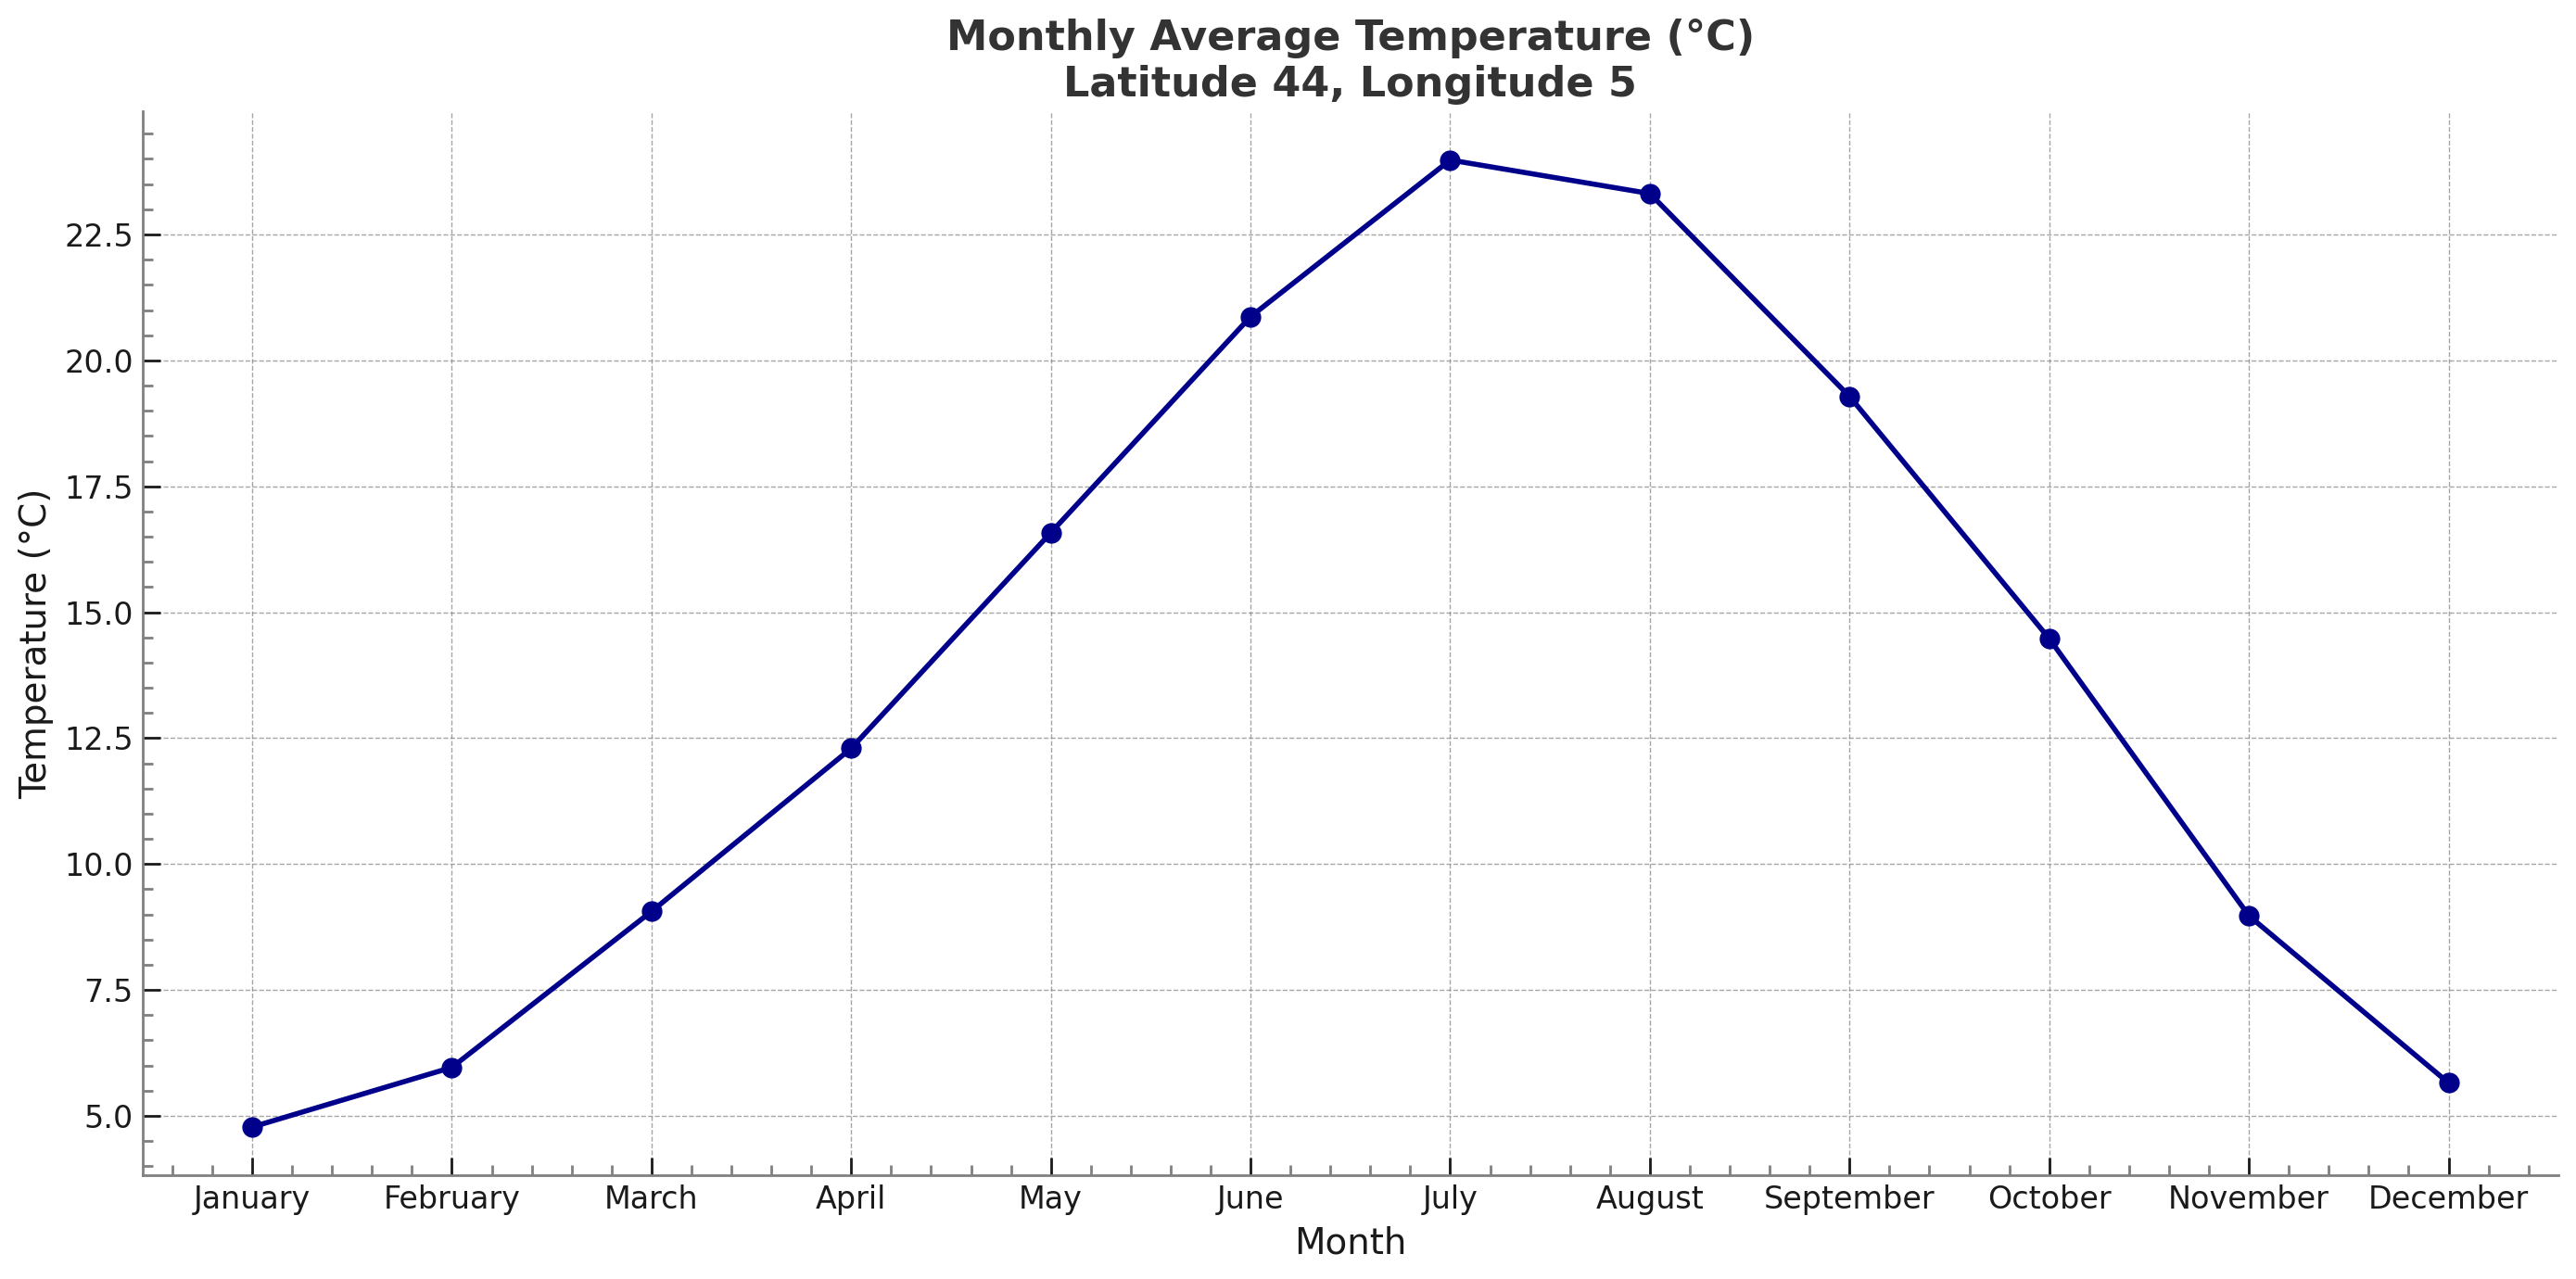
Use Case: Average Monthly Temperature (in Kelvin) over 44N, 5E
The JSON output provided encapsulates the findings from a climatology API, focusing on the average monthly temperatures at a specific geographic location. The metadata in the output includes essential details like the measured variable (temperature), the units (Kelvin), the time of data generation, and precise geographic coordinates (latitude 44, longitude 5). The data section presents the monthly average temperature values for a complete year.
How to Interpret This Information:
The data represents a location at 44°N latitude and 5°E longitude, analyzing temperature patterns. The temperatures are given in Kelvin and cover each month of the year, providing a comprehensive view of the temperature fluctuations over the seasons. The figures allow for an assessment of climatic conditions, seasonal changes, and potential trends in temperature at the specified location.
Our Specific Example:
The monthly average temperatures range from a minimum of approximately 277.93 Kelvin in January to a maximum of around 297.13 Kelvin in July. Converted to Celsius for ease of understanding, these values range from about 4.78°C in January to 24.0°C in July, illustrating a significant seasonal variation in temperature. The graph visualizes these changes, showing a clear trend of rising temperatures from January to July and then a gradual decrease towards December. This pattern is typical for temperate regions, reflecting the impact of the Earth's axial tilt on seasonal temperature variations.
Interpreting temperature data from a single location requires consideration of broader climatic factors. For a comprehensive understanding, it's crucial to analyze data from multiple locations and over extended periods. Climate variability and potential long-term trends can only be accurately assessed with extensive data. Additionally, temperature data alone does not provide a complete picture of climatic conditions; factors like precipitation, humidity, and wind patterns are also vital for a thorough understanding of the local climate.