Distribution Data API
Harness the power of historical climatic data with our Distribution Data API, your portal to the past, powered by the comprehensive ERA5 dataset. This API doesn't just give you data; it gives you the statistical distribution of climatic variables over time, enabling an unprecedented understanding of weather patterns.
Instead of mere averages, distribution data offers a robust picture of climatic behavior. It helps reveal patterns and probabilities, from common to rare events, which is essential for risk assessment, predictive modeling, and climate research.
- Variables Available
- Geographic Coverage
- Time Periods
Variable Selection
You can query the API for a variety of climatic variables, each critical for different aspects of climate study:
See variables
| Full Variable Name | Description | Short Variable | Distribution |
|---|---|---|---|
| 2m Temperature | Ambient air temperature at 2 meters above the ground | t2m | Gaussian |
| Total Cloud Cover | Proportion of the sky that is covered by clouds (0-1) | tcc | Beta |
Geographic Coordinates
Query data for specific coordinates with a granularity of 0.25° x 0.25°. Our coverage spans latitudes 70N to 35N and longitudes -20E to 40E, encompassing a wide expanse of Europe and adjacent regions.
Time Periods
Access climatic distributions dating from January 1993 through December 2022, with a 30-year average to guide your insights.
Methodology
Distributions are available for every hour, offering 8,760 unique snapshots per year—each one a detailed picture of climatic behavior across decades.
Inputs
The API accepts the following parameters:
-
start_time: The start time for historical data. -
end_time: The end time for historical data. -
Latitude: The geographical latitude for the location. -
Longitude: The geographical longitude for the location. -
Variable: The climatic variable for analysis.
Interactive Endpoint
You can access and interact with the API endpoints using our API Endpoint Directory.
Example Use Case: Zurich’s Temperature and Cloud Cover Profiles
- Temperature
- Cloud Coverage
Let’s take Zurich as an example. What does the temperature distribution look like throughout the year? How do the months differ? Here, the API shines, offering detailed temperature distributions for every hour of the year, based on a 30-year average.
Visualizing Yearly Temperature Patterns
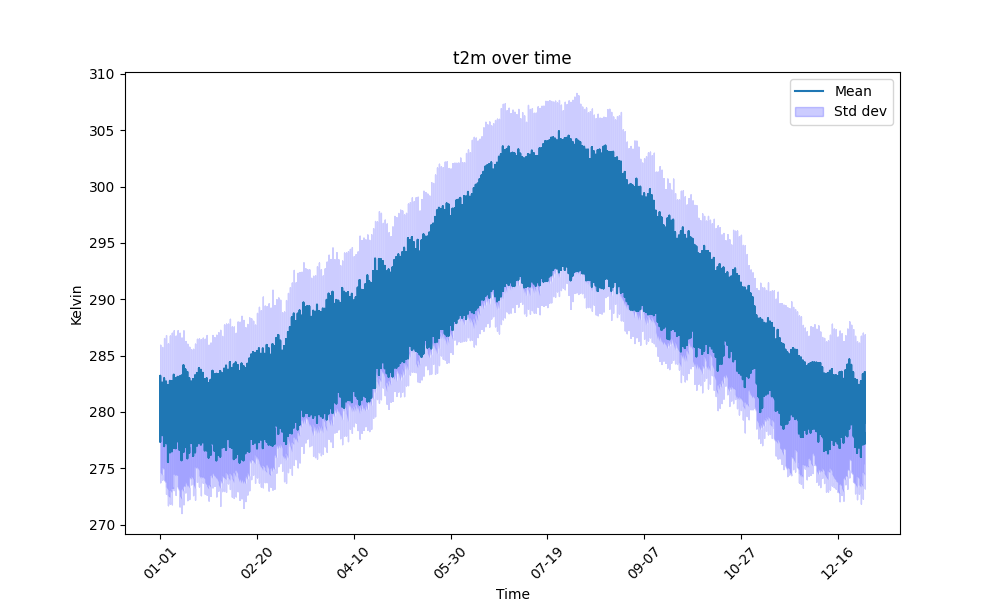 Displayed in Kelvin, this visualization reveals the ebb and flow of Zurich's temperature throughout the year—valuable for both granular and broad-scale analyses.
Extracting Actionable Insights
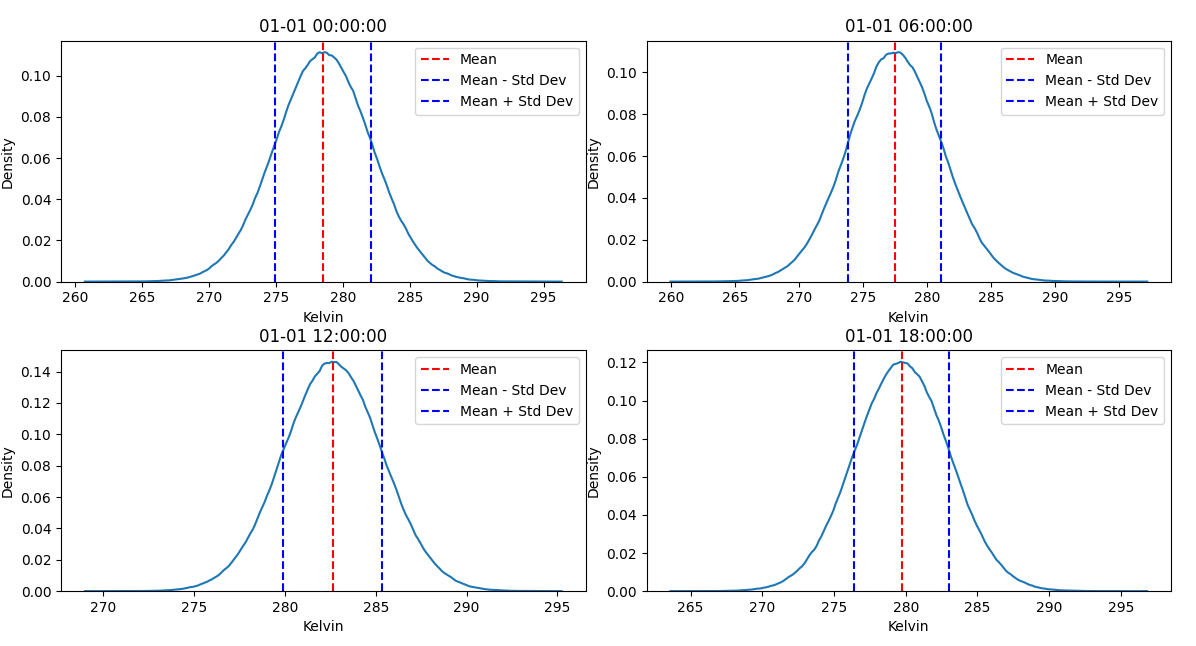 The real value emerges when dissecting the hourly temperature distributions. This data can empower Monte Carlo simulations, risk assessments, or bootstrap statistical predictions, providing the backbone for both climate modeling and decision-making tools.
In a case study focusing on Zurich, we can delve into the cloud cover dynamics over an entire year. The API provides comprehensive cloud cover data for every hour, derived from a 30-year historical average.
Visualizing Yearly Temperature Patterns
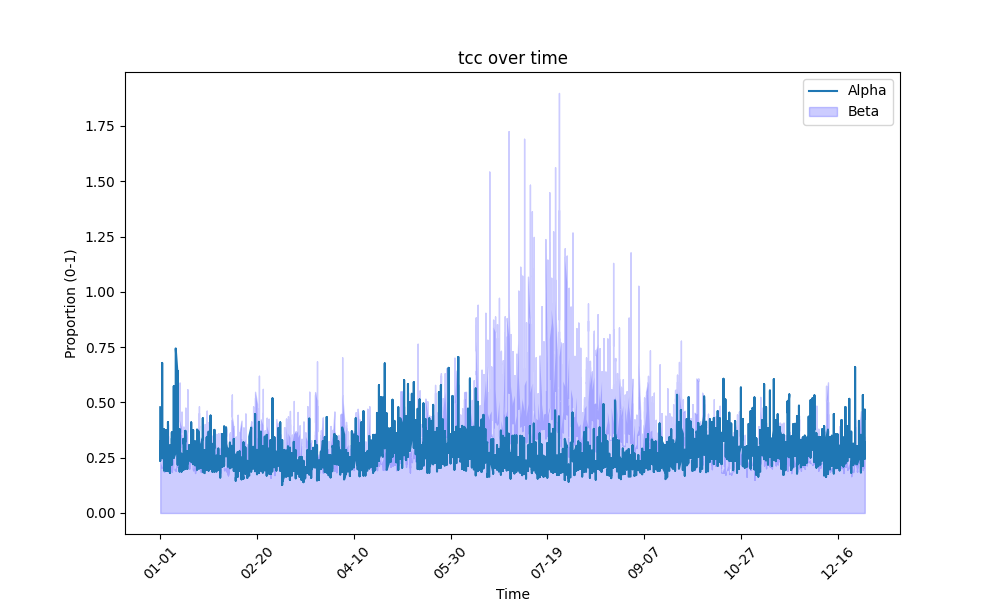 In the initial data representation, we are given raw alpha (α) and beta (β) parameters for each time point, which are essential components of a beta distribution. Unlike the temperature example, these parameters may not be directly indicative of the actual cloud cover but are crucial in shaping the distribution.
Extracting Actionable Insights
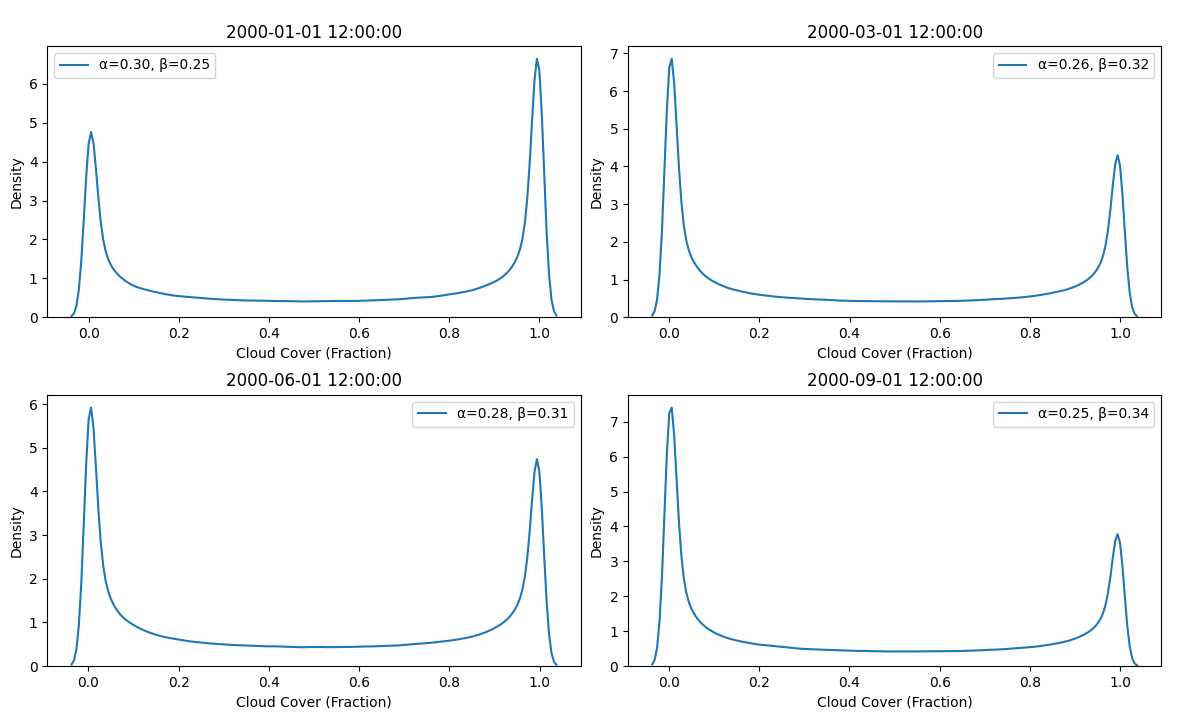 The second visualization takes these alpha and beta parameters and uses them to reconstruct the cloud cover distribution for specific hours. This is crucial for creating realistic models of cloud cover variance over time. Such detailed distributions allow us to anticipate cloud cover with greater accuracy, informing everything from climate modeling to operational planning for industries like renewable energy, where sunlight availability is critical. This approach underscores the importance of parameter-driven distributions in environmental data analysis and forecasting.