Raw Data API
The Raw Data API grants access to raw, unprocessed reanalysis data from the ERA5-Land dataset. This API is tailored for those requiring detailed, individual data points of climatic variables at specific locations and times.
The Raw Data API provides direct access to the ERA5-Land dataset's granular climate observations. It's designed for users who need exact data points for specific locations and times, without any data aggregation. This makes it suitable for detailed climate studies, such as analyzing the impact of weather events, understanding localized climate variations, or verifying climate models with precise historical data.
- Variables Available
- Geographic Coverage
- Time Periods
Choose the climatological variable for analysis:
See variables
| Full Variable Name | Description | Short Variable |
|---|---|---|
| 2m Dewpoint Temperature | Temperature at which air reaches saturation (dew point) at 2 meters above the ground | d2m |
| 2m Temperature | Ambient air temperature at 2 meters above the ground | t2m |
| 10m U Component of Wind | East-West (longitudinal) wind component at 10 meters above the ground | u10 |
| 10m V Component of Wind | North-South (latitudinal) wind component at 10 meters above the ground | v10 |
| Snow Cover | The fraction of land area covered by snow | snowc |
| Snow Density | The density of snow on the ground | rsn |
| Snow Depth | The depth of snow accumulated on the ground | sde |
| Snow Depth Water Equivalent | The amount of water contained within the snowpack | sd |
| Snow Fall | The amount of snowfall | sf |
| Snow Melt | The amount of snow melting over a given area and time period | smlt |
| Surface Pressure | Atmospheric pressure at the Earth's surface | sp |
| Surface Runoff | The flow of water occurring on the ground surface when excess rain can't be absorbed | sro |
| Total Evaporation | The total amount of water evaporated from the Earth's surface | e |
| Total Precipitation | The total amount of precipitation, including rain, snow, hail, etc. | tp |
Check our available geographical region page here.
The data covers the period from January 1950 to December 2022, offering individual data points for detailed analysis. The temporal resolution is currently monthly averages.
Methodology
Our dataset comprises a range of climatological variables, each providing unique insights into the Earth's climate system. These raw data points are crucial for studying specific climatic events or conditions without the generalization that comes with averaging.
-
Individual Data Points: We provide individual measurements for each climatological variable, enabling a more precise analysis of specific weather events or conditions.
-
Historical Span: The data spans from 1950 to 2022, offering a comprehensive historical perspective for detailed studies.
-
Model and Resolution: We use the ERA5-Land model reanalysis for this endpoint, which has a ~9km grid spacing.
Caution should be taken when talking about reanalysis data, as unlike direct historical observations, reanalysis data represents estimates of past weather conditions, reconstructed using models that combine past weather observations with modern forecasting techniques. This method offers a consistent and comprehensive data set that can be used to understand climatic changes over time. As a result, many scientists use reanalysis in place of observations.
Usage Instructions
Inputs
To interact with the API, the following input parameters must be provided:
-
variable: The variable for analysis, where you can use the short variables for analysis, corresponding to short variables in the table above. -
start_timeandend_time: The analysis timeframe in years (YYYY-MM). For example, from 2019-01 to 2019-12. The acceptable range is from1950-01to2022-12. The minimum difference between the start and end is 10 years, while the maximum is 30 years. -
latitude&longitude: The geographical coordinates in decimal degrees where the analysis is desired. Latitude ranges from -90 to 90, and longitude from -180 to 180. NOTE: please check our available geographical region page here to ensure the index is available in your desired region.
Interactive Endpoint
You can access and interact with the API endpoints using our API Endpoint Directory.
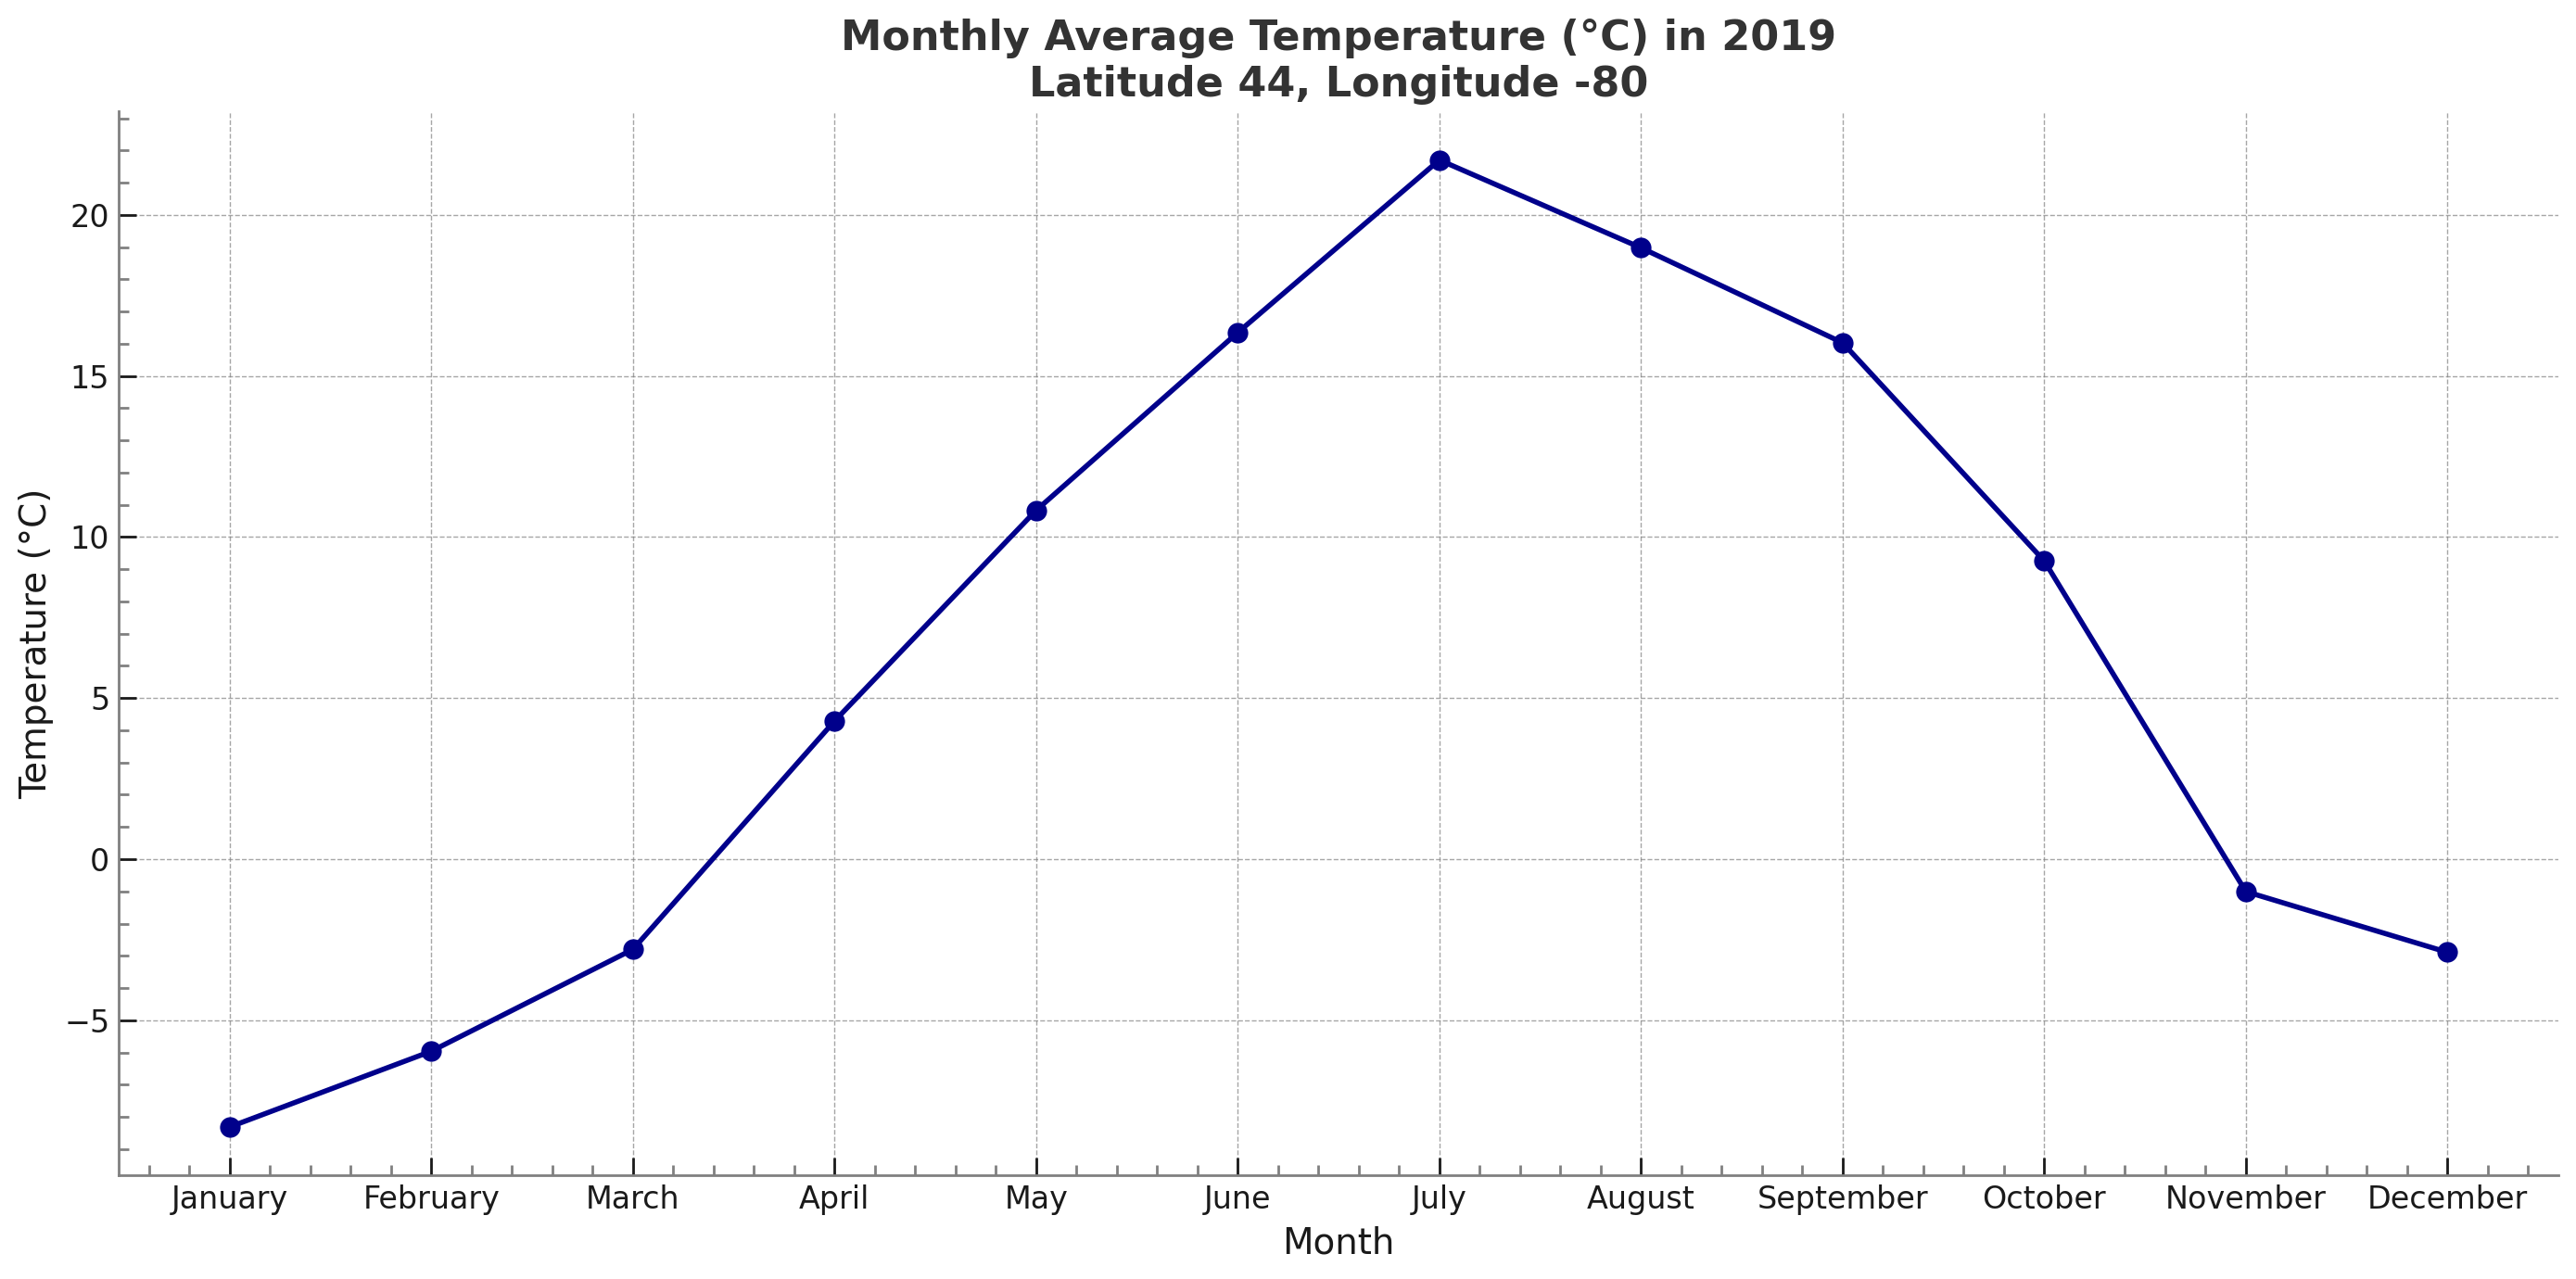
Use Case: 2019 Monthly Temperature (in Kelvin) over 44N, -80E
The JSON output provided encapsulates the raw data findings from our Raw Data API, focusing on individual temperature measurements at a specific geographic location. The metadata in the output includes key details like the measured variable (temperature), units (Kelvin), time of data generation, start_date, end_date, and precise geographic coordinates (latitude 44N, longitude 80W). The data section presents individual temperature measurements for each month in the year 2019.
How to Interpret This Information:
The data represents a location at 44°N latitude and -80°E longitude, providing an insight into specific temperature readings. These readings, given in Kelvin, showcase the temperature for each month in 2019, offering an in-depth view of temperature variations over the year. This raw data format allows for a detailed assessment of climatic conditions, monthly changes, and potential anomalies in temperature at the specified location.
Our Specific Example:
The individual temperature readings show a range from approximately 264.84 Kelvin in January to around 294.85 Kelvin in July. When converted to Celsius, these values span from about -8.31°C in January to 21.7°C in July, highlighting significant monthly temperature variations. The data allows for a precise examination of monthly climatic behavior, which is crucial for studying short-term climatic events or conditions.
When interpreting the raw temperature data provided by our API, it's important to recognize that this data is a result of reanalysis rather than direct measurements from individual weather stations. Reanalysis data is generated by integrating various data sources, including satellite observations and other meteorological inputs, with advanced modeling techniques. This process creates a consistent, comprehensive dataset for climatic analysis but does not represent direct, on-the-ground measurements.
Therefore, while reanalysis data is invaluable for understanding broad climatic trends and patterns, it may not capture the nuances or specific conditions experienced at a particular location or time as accurately as direct measurements would. Users should be mindful of this distinction, especially when using the data for applications that require high precision or locality-specific information. This understanding is crucial in interpreting the climate data responsibly and accurately.