Historical Trends API
The Historical Trends API provides access to historical climate trend data from the ERA5-Land dataset. It's designed for users who require insights into the long-term trends of climatic variables across several years at specific locations.
Historical Trends refer to the analysis of long-term changes in climate variables. This API focuses on identifying and quantifying these changes, providing users with detailed insights into how climate variables have evolved over time, based on monthly data from 1950 to 2022.
- Variables Available
- Geographic Coverage
- Time Periods
Select the climatological variable to analyze trends:
See variables
| Full Variable Name | Description | Short Variable |
|---|---|---|
| 2m Temperature | Trend in ambient air temperature at 2 meters above the ground | t2m |
This endpoint offers global coverage.
The trends are calculated from January 1950 to December 2022, offering insights into climatic changes over several decades.
Methodology
For a detailed understanding of our methodology in analyzing climatic trends, refer to the breakdown below:
Each variable in our dataset is analyzed to identify long-term changes, and this involves calculating the trend of each climatological variable over the period from 1950 to 2022, providing a comprehensive view of how each aspect of the climate has changed over time.
Data Collection and Analysis
-
Trend Analysis: Our approach involves identifying the slope of the trend line for each variable over the specified period. This quantifies how much a variable has increased or decreased over time.
-
Historical Span: The data covers from 1950 to 2022, enabling analysis of climatic trends over seven decades.
Statistical Approach
-
Linear Regression: We primarily use linear regression to calculate the trends, providing a statistical basis for identifying significant changes.
-
Data Consistency: It's crucial to maintain consistent data collection and processing methods across the entire period to ensure accurate trend analysis.
While trend analysis provides valuable insights into climatic changes, it's essential to approach this data with an understanding of its limitations, including the potential for statistical anomalies and the influence of natural climatic cycles.
Inputs
The API accepts the following parameters:
-
variable: The climatological variable for analysis, where you can use the short variables for analysis, corresponding to short variables in the table above. -
latitude&longitude: The geographical coordinates in decimal degrees where the analysis is desired. Latitude ranges from -90 to 90, and longitude from -180 to 180. NOTE: please check our available geographical region page here to ensure the index is available in your desired region.
Interactive Endpoint
You can access and interact with the API endpoints using our API Endpoint Directory.
Case Study: Climatic Temperature Trends in Zurich, Switzerland
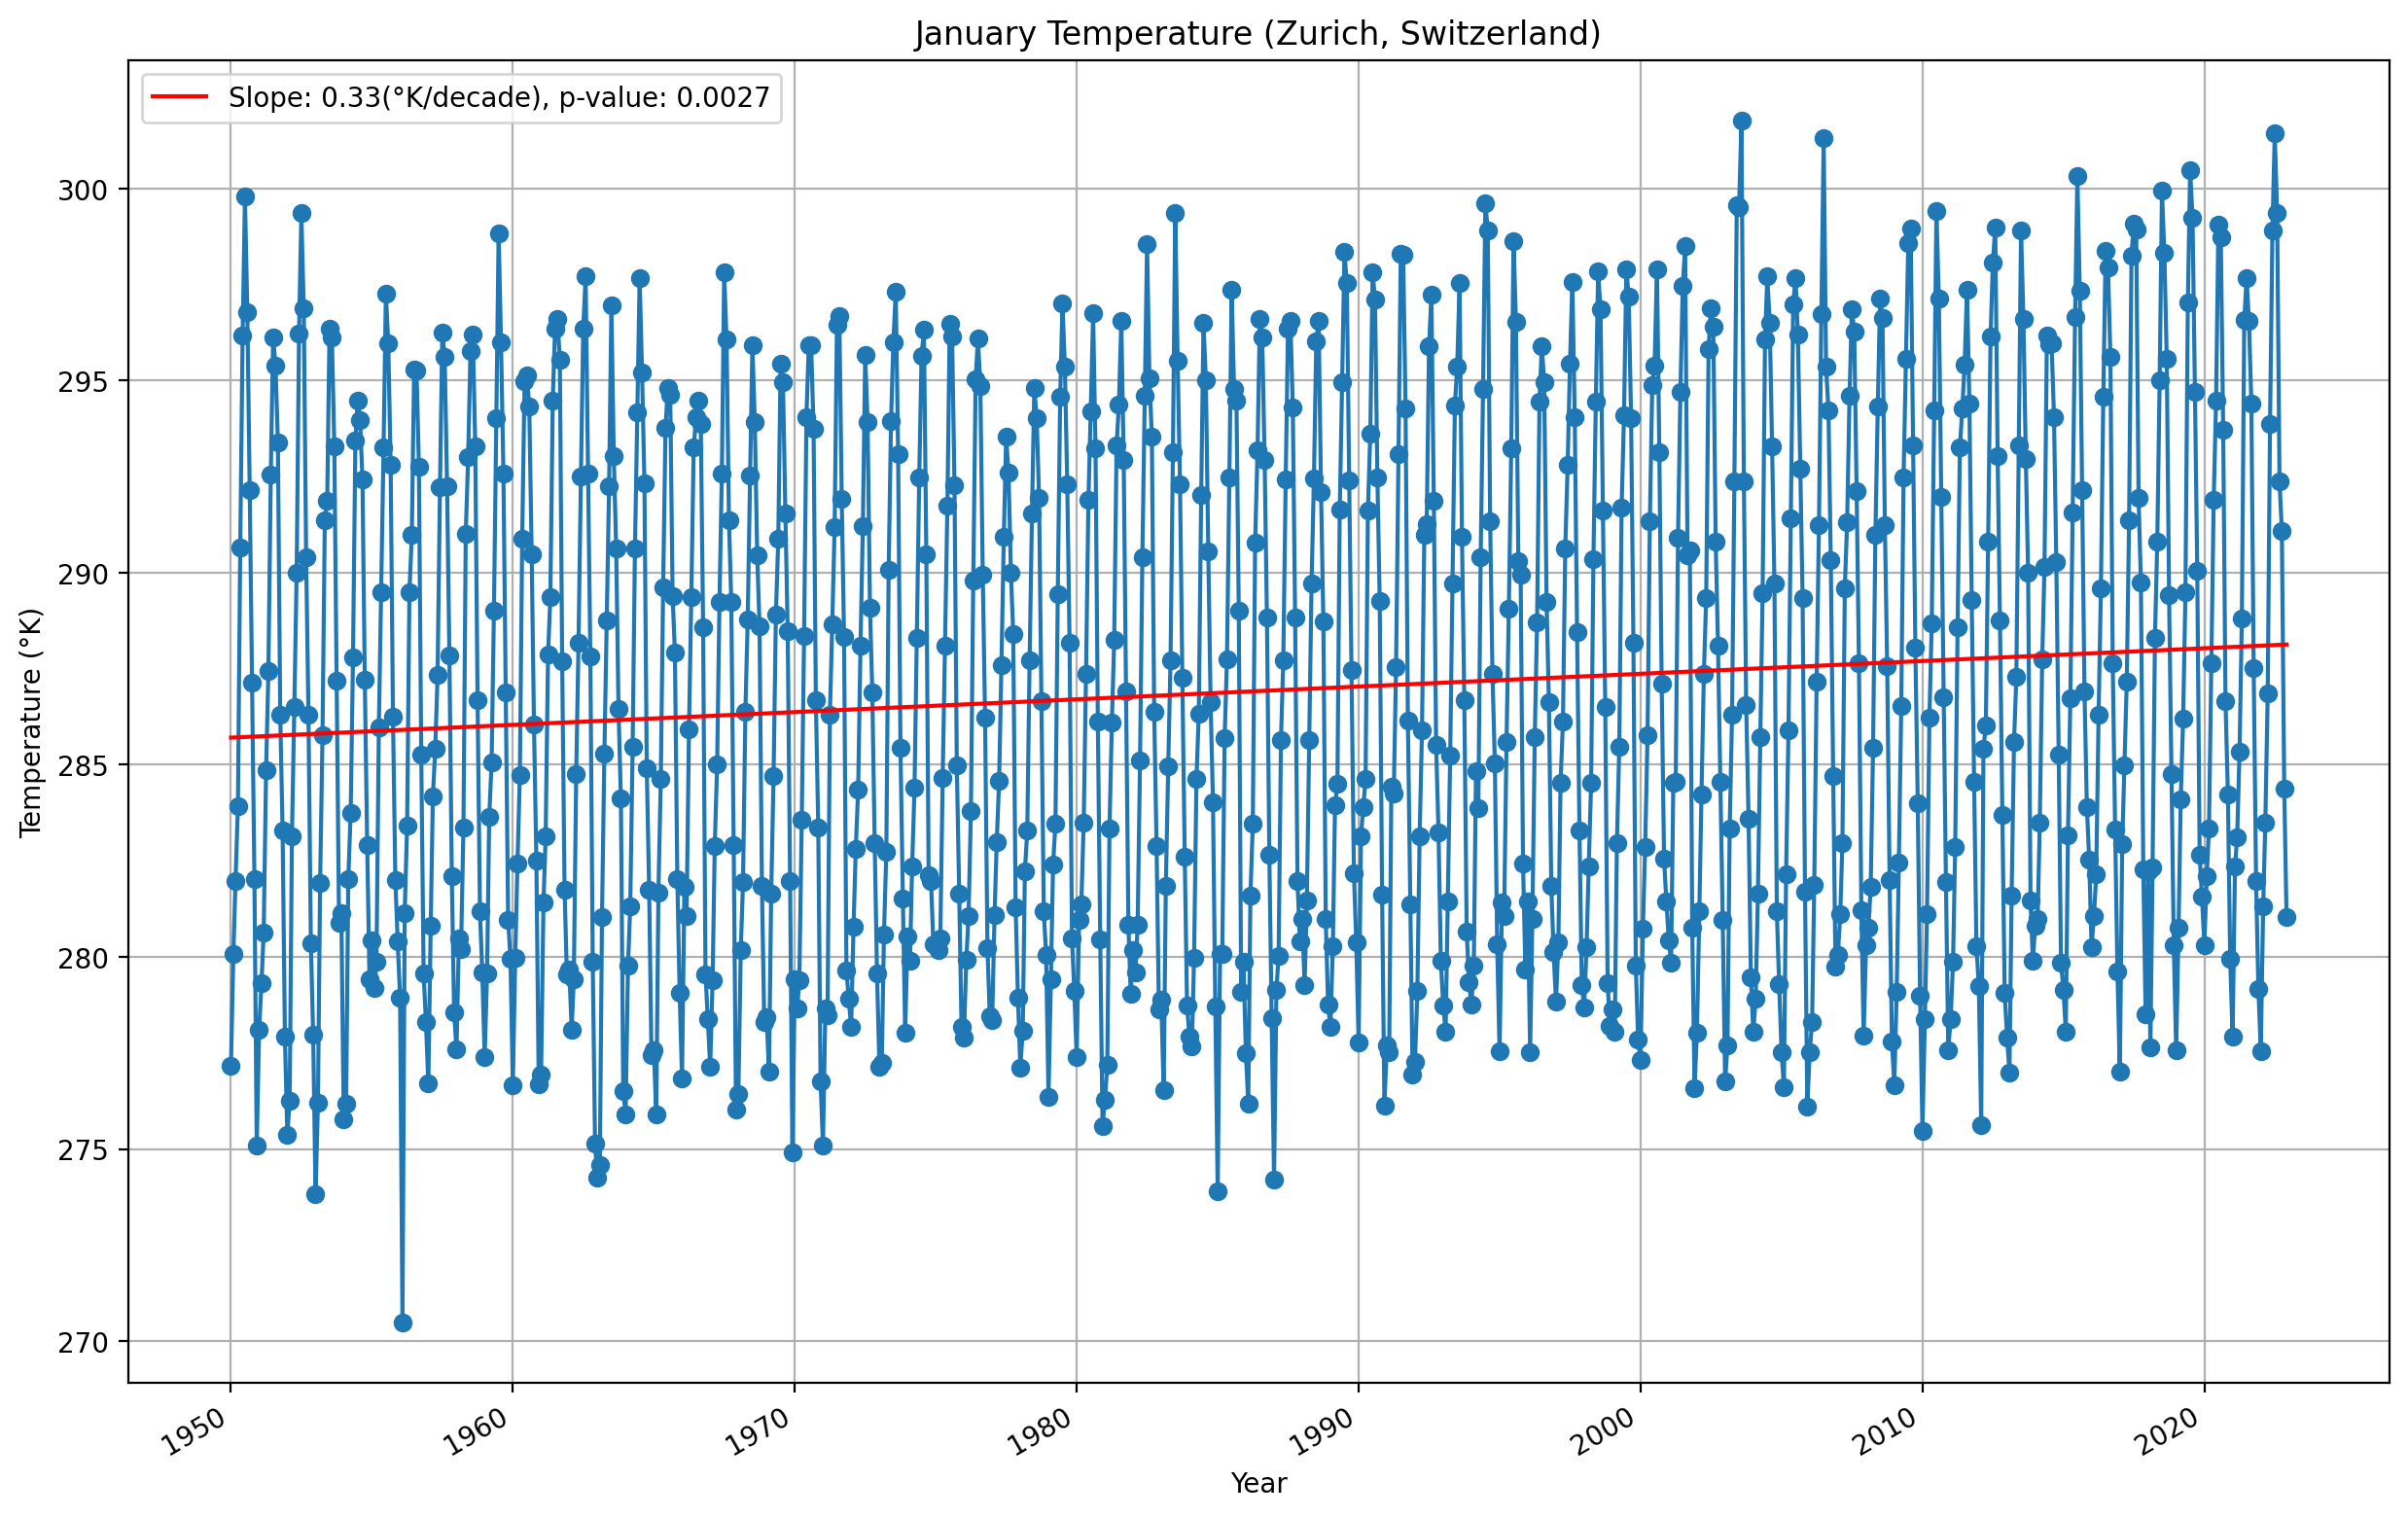
This graphical representation compiles temperature trends in Zurich, Switzerland, utilizing data from the Trend API alongside historical data obtained from the Raw Historical Data API. It presents the monthly average temperatures spanning numerous years. The dataset's metadata is thoroughly detailed, indicating the measurement type (temperature), the measurement unit (Kelvin), and precise data collection timestamps and geographic coordinates (latitude 44°N, longitude 5°E). The Trend API furnishes key statistical outputs including the slope of the trend line, the intercept at the initial time point (1950-01), the r-value indicating correlation strength, the p-value denoting trend significance (with values below 0.025 implying a confidence level above 95%), and the standard error of the estimate, offering a comprehensive overview of the temperature trends and their statistical validation.

Interpreting the Graph:
The graph showes temperature measurements taken at 44°N latitude and 5°E longitude, with an aim to study temperature trends in Zurich. Temperatures are presented in Kelvin for each month, allowing for a detailed examination of seasonal temperature shifts. The data showcases temperature patterns throughout the year, enabling analyses of climatic behavior, seasonal transitions, and potential warming or cooling trends at this particular site.
Case in Point:
The temperature data from Zurich undergo a meticulous trend analysis revealing a discernible pattern of change over the years. A key metric to consider is the slope derived from the Trend API, which is calculated to be 0.33 K/decade. This figure is indicative of a gradual increase in temperatures each decade, signifying a warming trend within the observed timeframe.
The p-value associated with this slope is 0.0027, which is well below the 0.05 threshold typically used to claim statistical significance. This low p-value suggests that there is less than a 0.27% chance that such a temperature increase could be due to random variations alone, reinforcing the reliability of the warming trend observed.
As a trend analysis example, this data from Zurich highlights the importance of long-term climatic monitoring. By using our statistical tools, we can transform raw temperature readings into actionable insights about climate patterns and their potential implications for the future.
When evaluating temperature data from a solitary location, it is imperative to account for wider meteorological factors. A robust understanding necessitates the scrutiny of data from various sites over long durations. Only through expansive datasets can climate variability and potential enduring trends be reliably discerned. It is also essential to recognize that temperature alone does not encapsulate the entire climate narrative; other elements such as rainfall, atmospheric moisture, and wind conditions are equally critical to a full comprehension of local climatic phenomena.