Composite Optimality Index
This Composite Optimality Index API endpoint calculates the composite optimality by considering weather data and constraints for a specific task and location. The response provides the composite optimality value, which represents the overall optimality considering multiple weather variables and constraints. For more reading on optimality, see our overview page.
Calculation Summary
The composite optimality is determined through a sophisticated calculation process that incorporates various weather variables and constraints. The process involves aggregating and analyzing relevant data to derive a composite optimality value. Please note that the specific equations and algorithms used in the calculation are proprietary and confidential.
Output
The output includes the composite optimality value for each timestamp in the forecast period. The value is a number between 0 and 1, where 0 indicates that the weather conditions are not optimal for the defined activity, and 1 indicates that the weather conditions are optimal for the defined activity. The output also includes the metadata for the forecast, including the forecast period, location, and timezone.
Usage Instructions
To use the Composite Optimality API, send a POST request with the required parameters. Below are the instructions on how to make requests to the API.
Inputs
The Composite Optimality API requires the following inputs to process the request:
latitude: Geographical latitude of the location (in decimal degrees).longitude: Geographical longitude of the location (in decimal degrees).forecast_hours: The duration for which the forecast is required, specified in hours.model: The weather model to be used for the forecast (e.g., 'noaa').id: The task identifier, which can be selected from a library curated by ClimaLinks, or custom made and from which only you have access.type: Currently, there are two types available, includingtaskorscenario, with the latter being a specific scenario unrelated to a task, such asheavy rain and windy.
Interactive Endpoint
You can access and interact with the API endpoints using our API Endpoint Directory.
Example Request
Here is a template for an example request using curl:
curl -X 'POST' \
    'https://api.climalinks.com/v1/optimality/composite/' \
    -H 'accept: application/json' \
    -H 'Content-Type: application/json' \
    -d '{
        "request": {
            "latitude": 47.37,
            "longitude": 8.54,
            "forecast_hours": 8,
            "model": "noaa"
        },
        "constraint_params": {
            "id": 86,
            "type": "task"
        }
    }'
Example Output and Interpretation
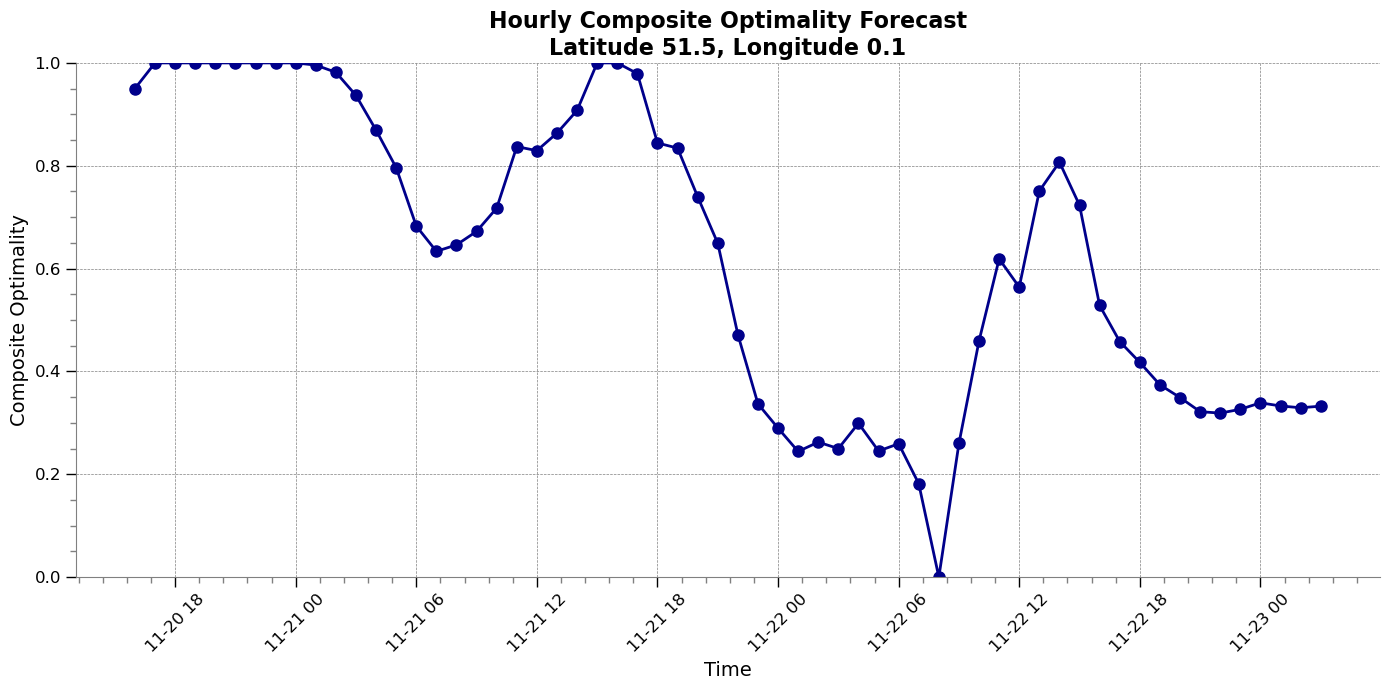
The JSON structure provided represents the output of the Composite Optimality Index API, specifically for assessing optimal crane operation conditions in London (Latitude 51.5, Longitude 0.1). This output is identified by id number 86 and is crucial for determining the best times to operate a crane, considering a combination of environmental variables.
How to Interpret This Information:
This dataset, generated by the noaa model under id 86, covers a 60-hour forecast period, starting from November 20, 2023, at 16:00 UTC. The forecast block provides hourly median Composite Optimality values. Notably, at longer lead times, such as up to 30 days into the future, Q10 and Q90 values become present, utilizing ensemble forecasting for enhanced precision.
Our Specific Example:
- Peak Optimality: There are several peaks near 1, indicating ideal conditions. Notable examples include November 20th at 17:00 and 18:00, and another peak on November 21st. These periods represent the most suitable times for crane operation in London.
- Significant Dip: The most significant dip occurs when the optimality value reaches zero on November 21st around 08:00, indicating highly unsuitable conditions for crane operation. This critical dip in suitability demands heightened caution or operational postponement. In this case, the user can use our API which breaks down each variable to identify the key variable and deteremine how to proceed (coming soon!).
Interpreting the Value:
- Greater than 0.9: Represents ideal conditions, such as seen on November 20th and 21st.
- Between 0.9 and 0.1: Conditions are acceptable but require careful consideration.
- Less than 0.1: Indicates unsuitable conditions, with a value of zero demanding operation cessation.
While the Composite Optimality Index is a valuable tool for planning crane operations in London, it should be part of a broader decision-making process. Furthermore, our tool is a means to digitize domain knowledge, and relies on the user knowing their ideal and acceptable constraint levels. Operational decisions should also consider real-time weather changes, site-specific factors, and professional judgment. The index should be used in conjunction with on-the-ground assessments and expert advice for maximum safety and efficiency.
{
  "metadata": {
    "generated_at": "2023-11-03T10:18:29.504288+00:00",
    "model": "noaa",
    "id": 86,
    "forecast_hours": 60,
    "timezone": "UTC",
    "location": {
      "latitude": 51.5,
      "longitude": 0.1
    },
    "start_date": "2023-11-20T16:00:00Z",
    "end_date": "2023-11-23T03:00:00Z"
  },
  "forecast": [
    {
      "timestamp": "2023-11-20T16:00:00Z",
      "median": 0.9502,
      "Q10": null,
      "Q90": null
    },
    {
      "timestamp": "2023-11-20T17:00:00Z",
      "median": 1,
      "Q10": null,
      "Q90": null
    },
    {
      "timestamp": "2023-11-20T18:00:00Z",
      "median": 1,
      "Q10": null,
      "Q90": null
    },
    {
      "timestamp": "2023-11-20T19:00:00Z",
      "median": 1,
      "Q10": null,
      "Q90": null
    },
    "...."

    {
      "timestamp": "2023-11-23T03:00:00Z",
      "median": 0.3325,
      "Q10": null,
      "Q90": null
    }
  ]
}