Thermal Stress Index
The Thermal Stress Analysis endpoint offers a comprehensive examination of human-perceived temperature extremes influenced by climate change scenarios. It utilizes recognized thermal indices, such as Humidex and Windchill, to measure the combined effects of heat and humidity or wind and temperature, respectively.
This endpoint is designed to retrieve return periods for specific thermal stress scenarios based on historical data and predictive models for future conditions. These metrics are pivotal for sectors like public health, urban planning, and environmental monitoring, which require accurate forecasts and likelihood analysis of thermal stress events for risk assessment and strategic planning.
The Humidex and Windchill indices are essential tools for evaluating the human-perceived effects of temperature. They take into account more than just the thermometer readings, providing a more comprehensive understanding of thermal stress.
-
Humidex: This index combines air temperature with humidity to reflect the perceived temperature. High humidity levels can significantly increase discomfort, as they hinder the body’s ability to cool itself through perspiration. The Humidex is particularly useful in hot, humid climates where it can help to identify potentially dangerous conditions for heat stress.
-
Windchill: In contrast, Windchill is an index that combines air temperature with wind speed to estimate the chilling effect of the wind on the human body during cold weather. It reflects how cold the weather feels on exposed skin, which can be significantly colder than the actual air temperature. Windchill is crucial for understanding the potential for frostbite and hypothermia in cold, windy conditions.
Index Creation Methodology
For an in-depth understanding of our calculation process, refer to the detailed breakdown below:
🌡️ Detailed Breakdown: Unpacking Thermal Stress Calculations
Data Collection and Index Calculation
- Annual Extremes: Our models consider the highest and lowest index (e.g., humidex or windchill) values annually to determine thermal stress, focusing on human-perceived temperature extremes. These extremes are calculated from an initial monthly field, representing long term trends.
Statistical Analysis and Thresholds for Extremes
-
Return Periods: By determining the index values for specific return periods, we identify how often extreme thermal conditions are likely to occur. These periods are statistical estimates indicating that an event of a certain intensity is expected to happen on average once within a given number of years.
-
Gumbel Distribution: To model the occurrence of extreme index values, a Gumbel distribution is fitted to the annual maximums. This approach is suitable for assessing the risk of rare and significant events.
Thermal Stress Types
- The Humidex metric combines temperature and humidity to represent how hot the weather feels to the average person.
- The Windchill index measures how cold it feels based on the wind speed and actual air temperature.
Interpretation of Thermal Stress Levels
Humidex:
- Low Risk: Below 20°C.
- Increased Risk: Above 30°C.
If your extreme values never rise above 20°C, you should disregard humidex as your thermal stress metric, indicating a minimal chance of high-temperature stress.
Windchill:
- Low Risk: Between 0°C and -10°C.
- Increased Risk: Below -10°C.
If your extreme values never fall below 0°C, you should disregard windchill as your thermal stress metric, indicating a minimal chance of low-temperature stress.
Interpolation between data points for return periods can be performed, but caution is advised when interpreting values outside the standard range of 1 in 2 to 1 in 100 years to maintain accuracy.
Understand the specific thermal indices and choose the appropriate one for your climate analysis needs. Misinterpretation can lead to incorrect assessments of thermal stress risks.
Usage Instructions
This API provides insights into thermal stress changes over time, analyzing heat and cold events, their frequency, and intensity based on various climate models and scenarios.
- Return Period
- Likelihood Change
- Return Period Change
Endpoint 1: Extreme Thermal Stress Return Period
Retrieve 1 in 2, 5, 10, 20, 50, and 100 years for both historical (1950 to 2010) and future (based on entered period) on thermal stress distribution. This can allow for understanding potential future deviations and impacts on perceived temperature.
Inputs
thermalstress_type: The type of thermal stress, such ashumidexorwindchill.latitude: Geographical coordinate (decimal degrees) specifying north–south position.longitude: Geographical coordinate (decimal degrees) specifying east-west position.time_period: The range of years for the analysis, e.g.,2020_2050.model: The climate model to be used for the analysis. Example:cmip6_ec_earth3_cc
Use Case: Change in Humidex return periods by 2070-2100 over Zurich, Switzerland
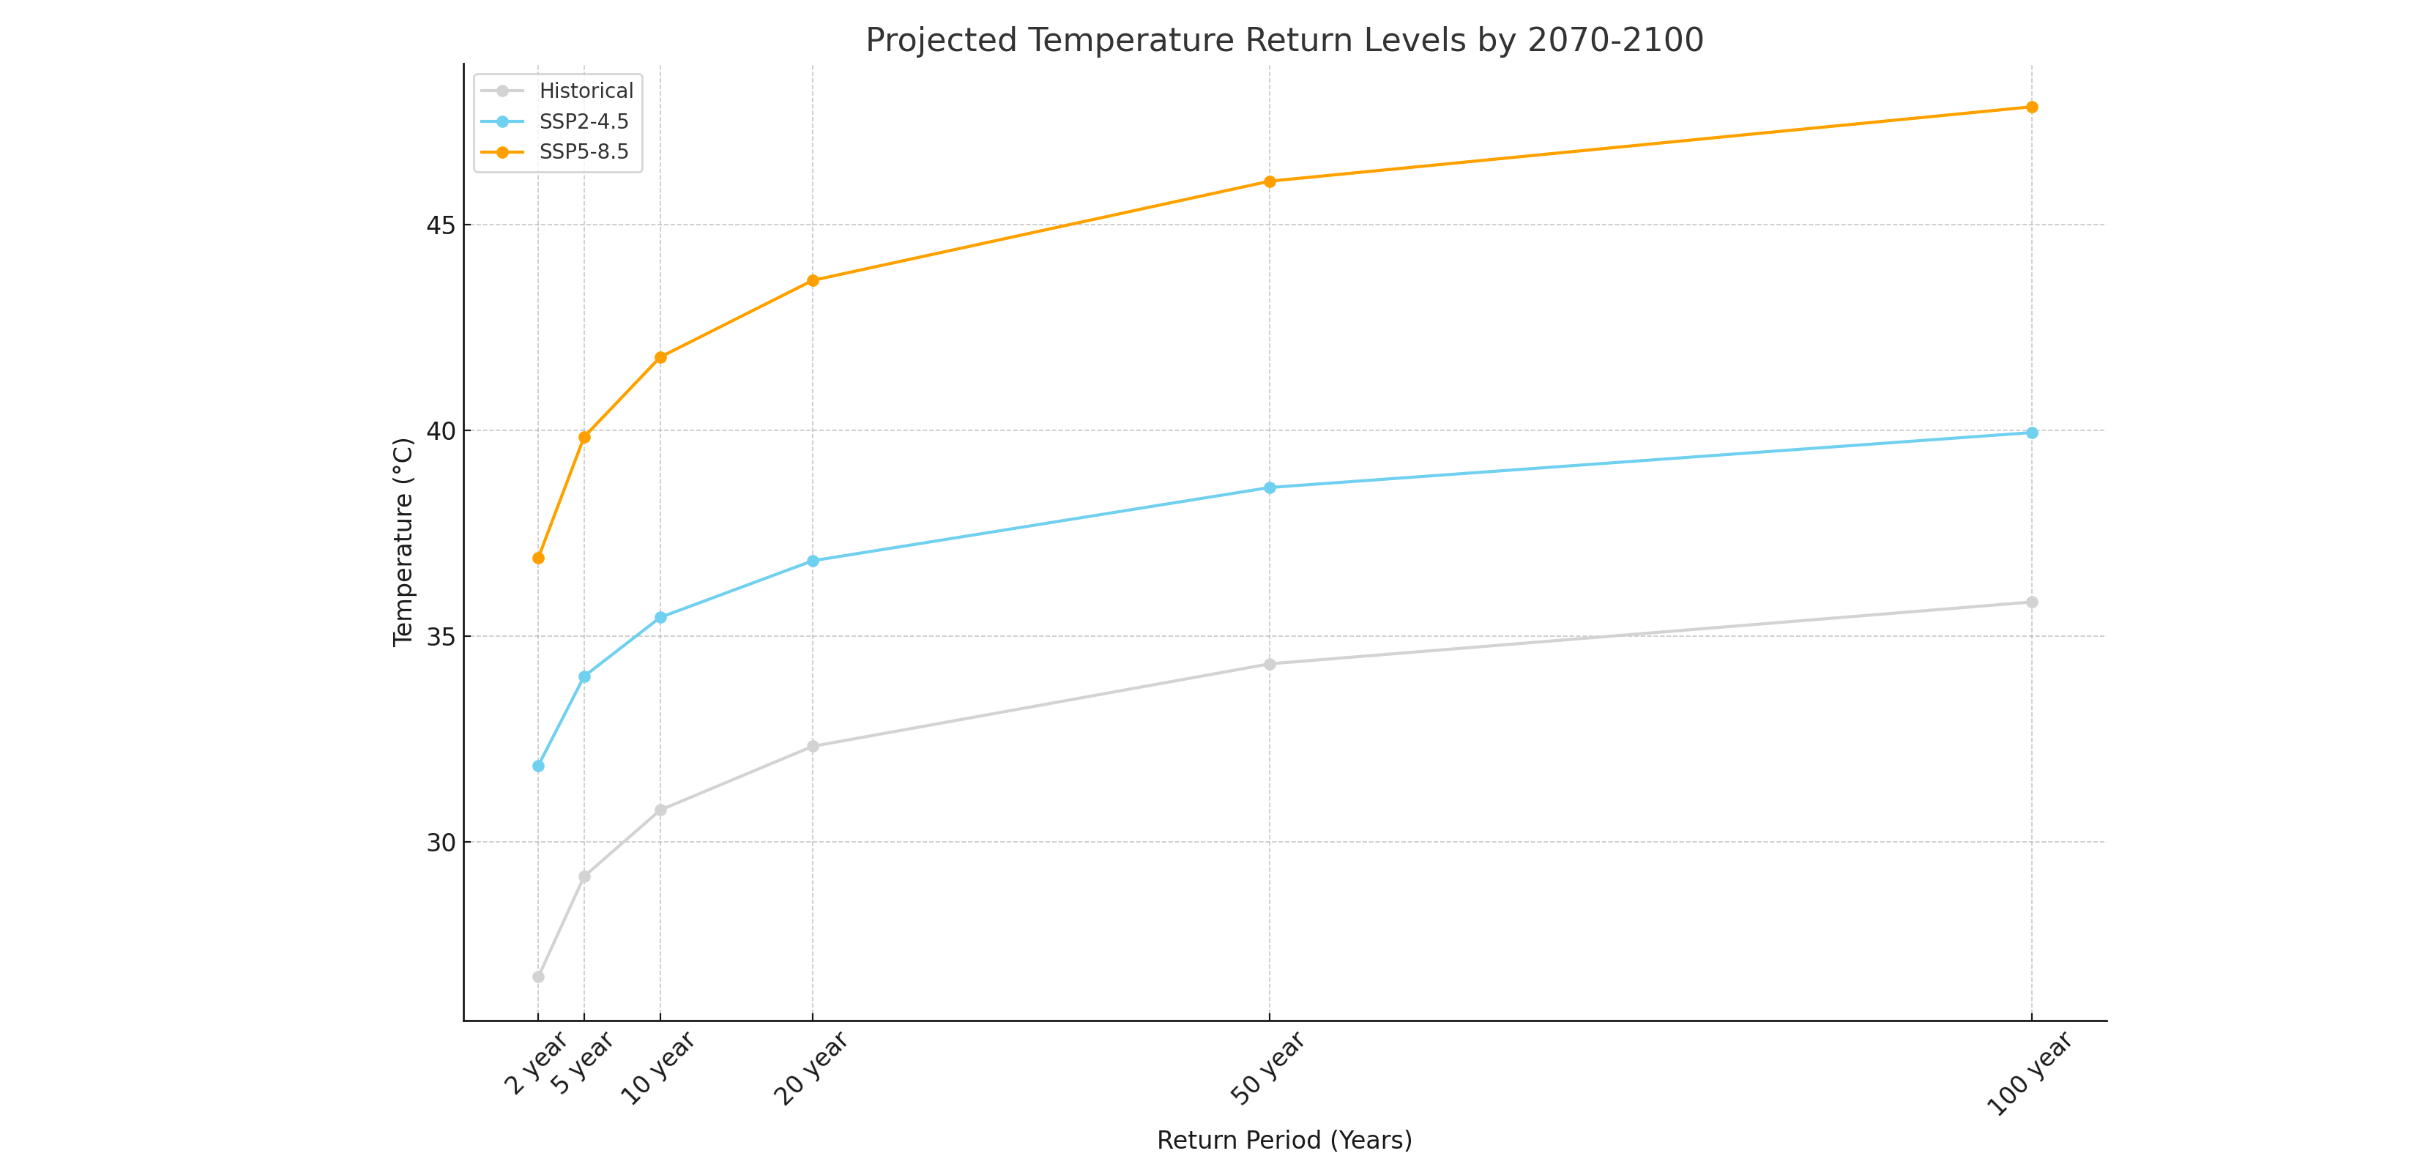
In this example, we're examining the values associated with specific return periods, such as 1 in 2, 5, 10, 20, 50, or 100 years. Historically, the annual extreme humidex value for a 1 in 100 year return period has been 35.8266 C. However, projections indicate a significant increase in this extreme by the years 2070-2100. Under the SSP2-4.5 scenario, the extreme is expected to rise to 39.9455 C, and under the SSP5-8.5 scenario, it could reach a staggering 47.8647 C.
Example API Output:
{
  "metadata": {
    "generated_at": "2024-02-16T15:09:38.115543+00:00",
    "nearest_location": {
      "latitude": 43.85954,
      "longitude": 4.921875
    },
    "time_period_historical": "1950_2010",
    "time_period_projection": "2070_2100",
    "units": "degree_celsius"
  },
  "return_periods": {
    "historical": {
      "2_year": 26.7157,
      "5_year": 29.1548,
      "10_year": 30.7698,
      "20_year": 32.3189,
      "50_year": 34.324,
      "100_year": 35.8266
    },
    "ssp2_4_5": {
      "2_year": 31.8518,
      "5_year": 34.0186,
      "10_year": 35.4533,
      "20_year": 36.8294,
      "50_year": 38.6107,
      "100_year": 39.9455
    },
    "ssp5_8_5": {
      "2_year": 36.9033,
      "5_year": 39.8379,
      "10_year": 41.7808,
      "20_year": 43.6445,
      "50_year": 46.0569,
      "100_year": 47.8647
    }
  }
}
Endpoint 2: Thermal Stress Likelihood Change
Retrieve the alteration in thermal stress return periods that indicate human-perceived temperature deviations across various scenarios. The metrics humidex and windchill are utilized to depict human-perceived temperature, which takes into account both temperature and variables like humidity or wind speed. Analysis does not use a specific index value, but instead a likelihood. For example, you can deteremine how a historical 1 in 50 year event will change, such as becoming a 1 in 25 year event.
Inputs
thermalstress_type: The type of thermal stress, such ashumidexorwindchill.return_period: The return period for which the likelihood change is analyzed. Example: 1 in 50 event.latitude: Geographical coordinate (decimal degrees) specifying north–south position.longitude: Geographical coordinate (decimal degrees) specifying east-west position.period: The period for which the likelihood change is analyzed. Example:2020_2050.model: The climate model to be used for the analysis. Example:cmip6_ec_earth3_cc
Use Case: Change in Humidex 1 in 100 year return periods by 2050-2070 over Zurich, Switzerland
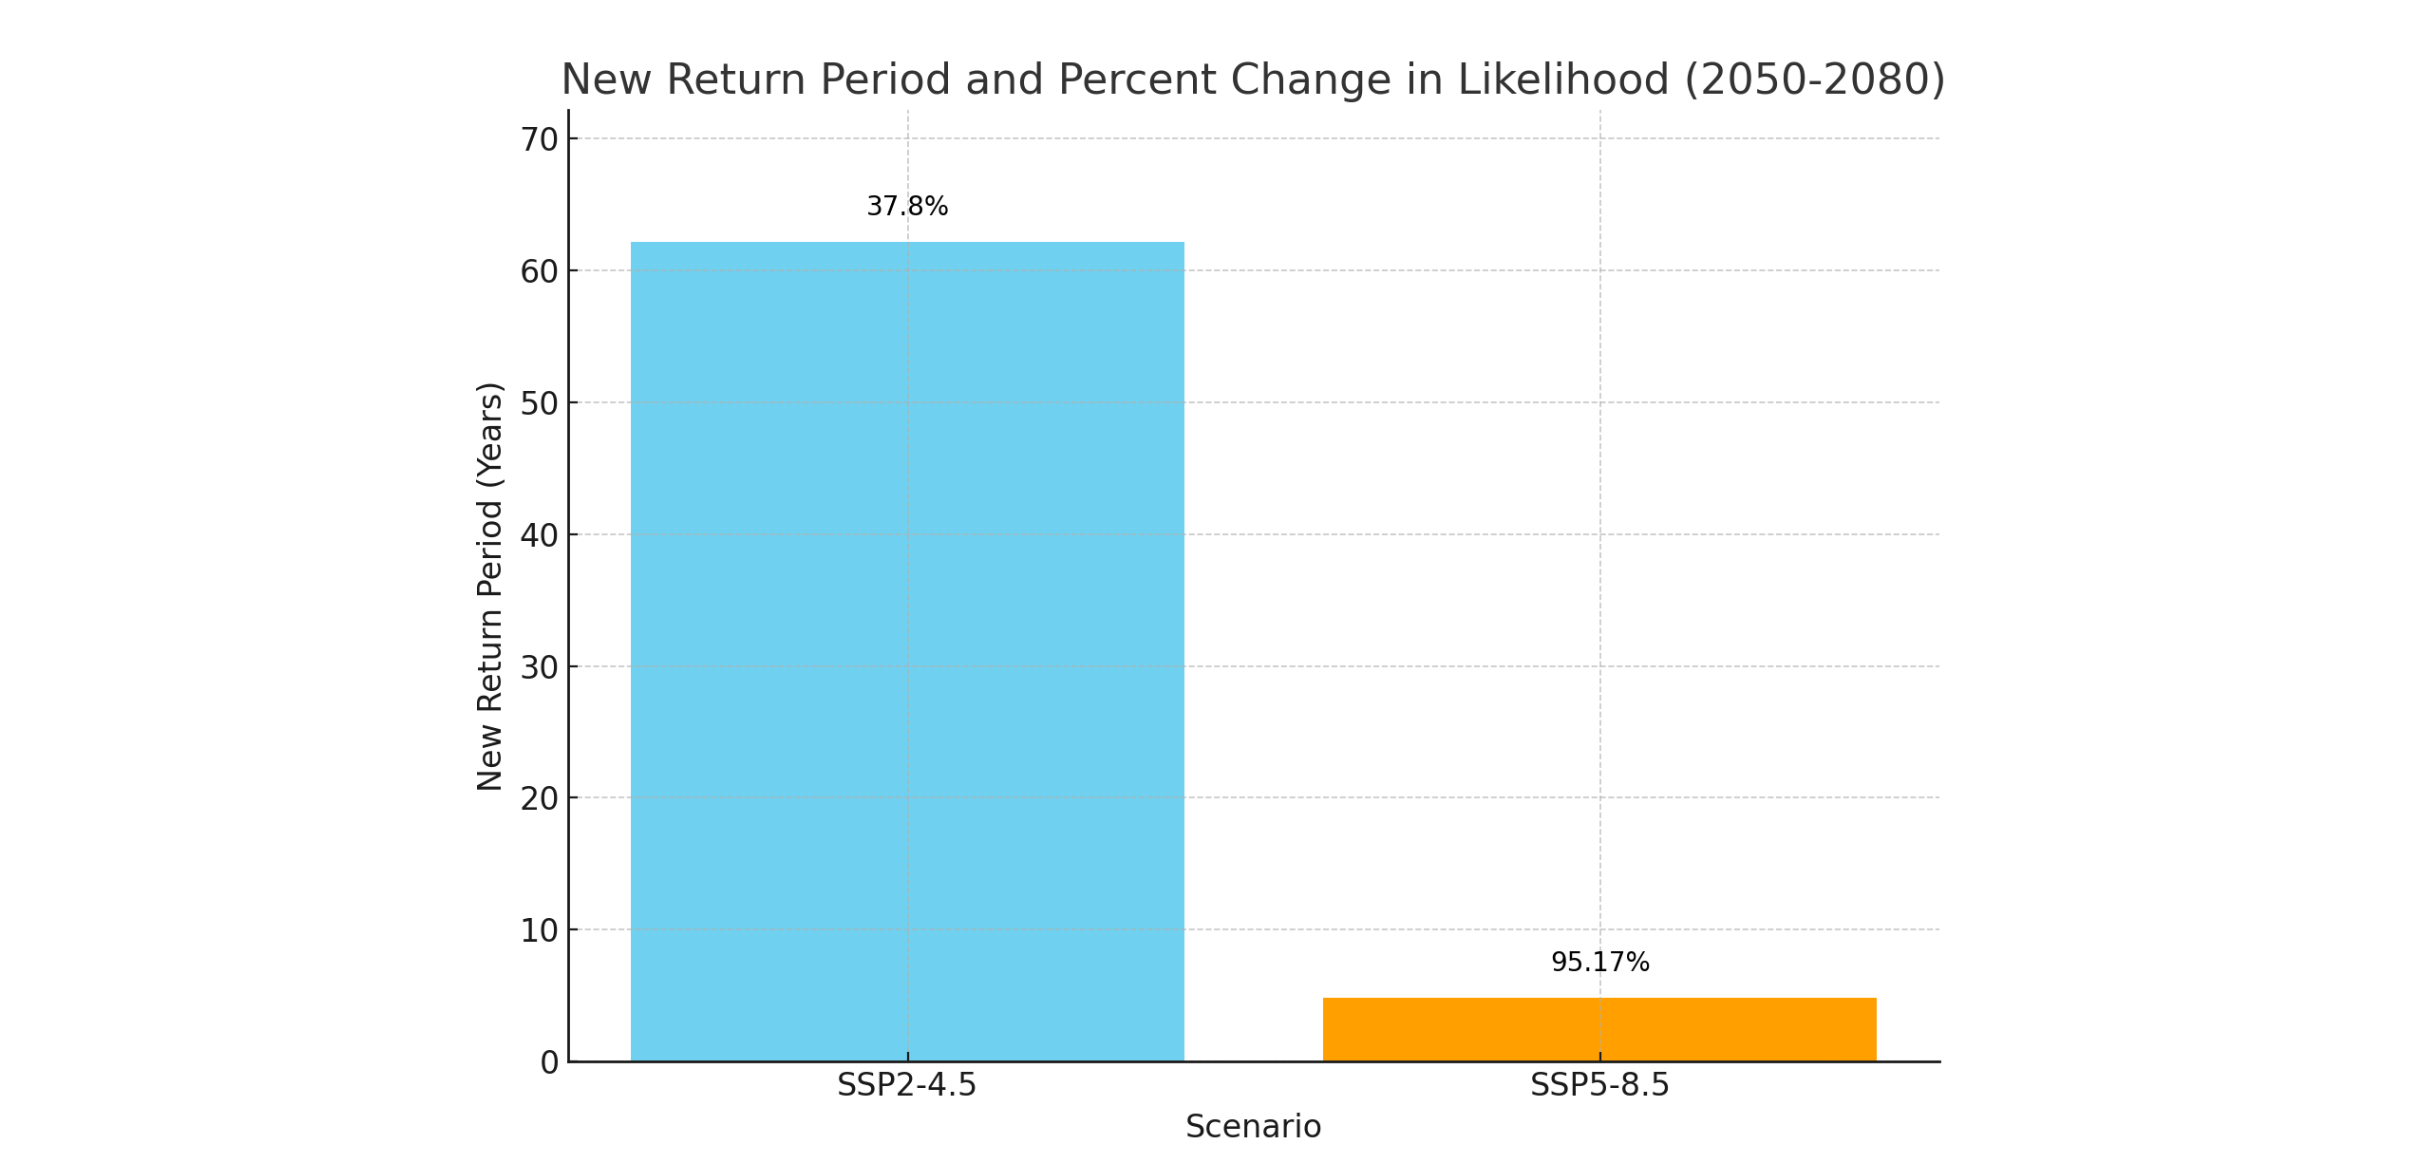
In this analysis, we're scrutinizing the shift in the probability of extreme humidex events, which were historically characterized as 1-in-100-year occurrences. Future projections signal a substantial escalation in these extremes. Under the SSP2-4.5 scenario, such events are predicted to occur every 62 years, marking a 37.8% increase in frequency. Even more strikingly, under the SSP5-8.5 scenario, these events could become as common as once every 4.83 years, signifying a dramatic 95.17% surge in likelihood.
Example API Output:
{
  "metadata": {
    "generated_at": "2024-02-16T15:29:22.612129+00:00",
    "nearest_location": {
      "latitude": 43.85954,
      "longitude": 4.921875
    },
    "time_period_historical": "1950_2010",
    "time_period_projection": "2050_2080"
  },
  "scenarios": {
    "ssp2_4_5": {
      "new_return_period": 62.2,
      "percent_change_in_likelihood": 37.8
    },
    "ssp5_8_5": {
      "new_return_period": 4.83,
      "percent_change_in_likelihood": 95.17
    }
  }
}
Endpoint 3: Thermal Stress Return Period Change
Retrieve the return period for a specific thermal stress return periods for both historical and scenario based datasets, indicating shifts in human-perceived temperature anomalies for various scenarios. The change in return periods can shed light on how often extreme thermal events might occur in the future compared to historical data. For example, 34°C might is a 1 in 45.15 year event, but by 2050_2080 this value becomes a 1 in 16.83 and 1 in 2.72 year event for SSP2-4-5 and SSP5-8-5 respectively.
Inputs
thermalstress_type: The type of thermal stress, such ashumidexorwindchill.value: The specific value of the thermal stress for which likelihood is analyzed.latitude: Geographical coordinate (decimal degrees) specifying north–south position.longitude: Geographical coordinate (decimal degrees) specifying east-west position.period: The period for which the likelihood for the value is queried. Example:2020_2050.model: The climate model to be used for the analysis. Example:cmip6_ec_earth3_cc
Use Case: Shift in the probability of an annual maximum of 35C by 2050-2070 (Zurich, Switzerland)
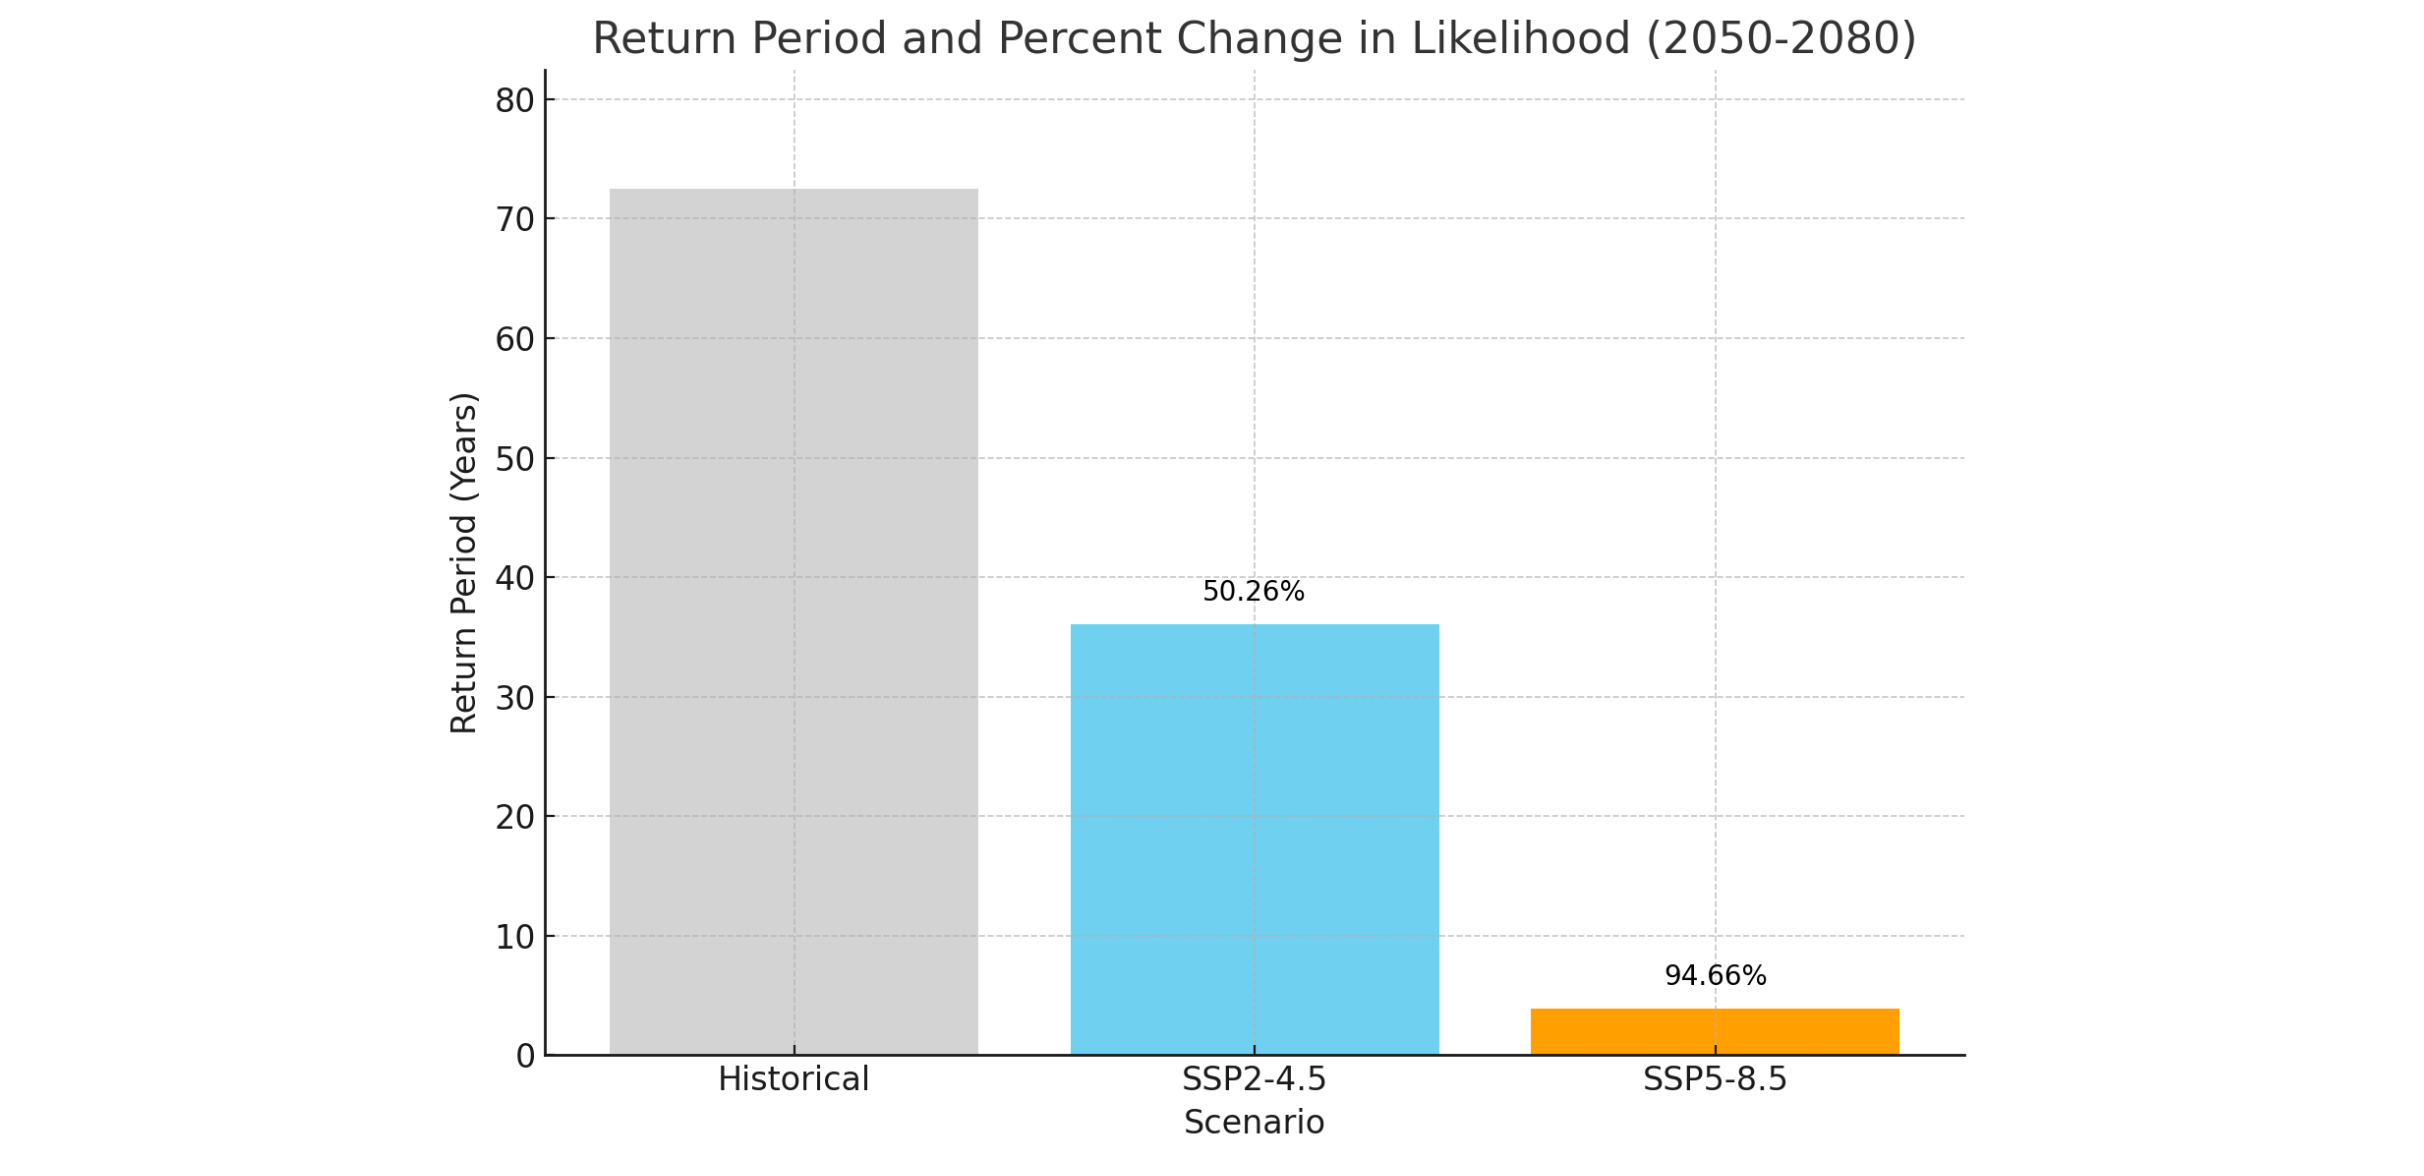
In this study, we're examining the frequency of a specific humidex value, notably 35C, over Zurich. Historically, such a temperature event has been a rarity, occurring once every 72.49 years. However, climate change is set to disrupt this pattern, making these events more frequent. Under the SSP2-4.5 scenario, we can expect such an event every 36.06 years, and alarmingly, under the SSP5.8-5 scenario, it could become a nearly annual occurrence, happening once every 3.87 years.
Example API Output:
{
  "metadata": {
    "generated_at": "2024-02-16T15:36:52.389288+00:00",
    "nearest_location": {
      "latitude": 43.85954,
      "longitude": 4.921875
    },
    "time_period_historical": "1950_2010",
    "time_period_projection": "2050_2080"
  },
  "scenarios": {
    "historical": {
      "original_return_period": 72.49
    },
    "ssp2_4_5": {
      "new_return_period": 36.06,
      "percent_change_in_likelihood": 50.26
    },
    "ssp5_8_5": {
      "new_return_period": 3.87,
      "percent_change_in_likelihood": 94.66
    }
  }
}
Interactive Endpoint
You can access and interact with the API endpoints using our API Endpoint Directory.
References and Further Reading:
Gumbel, Emil Julius. Statistics of extremes. Columbia university press, 1958. Access the textbook.