Standardized Precipitation Index
The Standardized Precipitation Index (SPI) delivers a nuanced metric that quantifies deviations in precipitation, providing insights into drought and surplus moisture conditions. Relying on a time-tested methodology from McKee, Doesken, and Kleist (1993), the SPI allows for a precise evaluation of precipitation anomalies over various timescales — crucial for sectors ranging from agriculture, which hinges on short-term water availability, to water supply and hydroelectric power, where the focus is on long-term trends. This sophisticated tool is instrumental in strategic planning, offering a clear perspective on water-related risks up to present timescales.
Our 1-Month Standardized Precipitation Index (SPI) helps to identify sudden dry/wet spells or unusual changes in monthly rainfall. This index is especially useful for recognizing the early stages of drought, as a consistent pattern of negative SPI values can suggest the onset of drier conditions. However, it's important to acknowledge that the SPI isn't a standalone solution. For a thorough analysis of drought conditions, it's necessary to also consider other factors like temperature changes and human activity. Integrating these elements with the SPI can provide a clearer, more complete picture of potential drought or wetspell impacts.
Index Creation Methodology
For an in-depth understanding of our calculation process, refer to the detailed breakdown below:
🌧️ Detailed Breakdown: Unpacking Our SPI Calculations
Temporal Resolution and Data Handling
- Monthly Averages: Our index utilizes monthly average precipitation data, including both rainfall and accumulated snowfall, to establish a reliable baseline for comparisons.
Probability Distribution
- Statistical Modeling: To map precipitation probabilities, we employ sophisticated statistical methods such as kernel density estimation and gamma distribution fitting.
Defining Drought and Wet Conditions
- Baseline Normalization: The SPI is computed by normalizing precipitation against long-term historical averages (1950-2010), setting a benchmark for typical weather patterns.
Drought Intensity Levels
- Moderate Drought: Characterized by an SPI ranging from -1.5 to -1.0.
- Severe Drought: Defined by an SPI ranging from -2.0 to -1.5.
- Extreme Drought: Identified when the SPI is less than -2.0.
Wet Intensity Levels
- Moderate Wet: Denoted by an SPI ranging from 1.0 to 1.5.
- Severe Wet: Occurs when the SPI is between 1.5 and 2.0.
- Extreme Wet: An SPI greater than 2.0 indicates this condition.
In extremely dry areas, factors beyond precipitation, including evaporation, soil moisture levels, and occasional groundwater influx, play significant roles in the hydrological context. SPI, which focuses solely on precipitation anomalies, may not fully reflect the intricate dynamics of drought conditions or water scarcity in these environments.
The reliability of SPI in desert regions can be compromised by the scarcity of historical precipitation data. Sparse rainfall events and limited hydrological records may affect the index's ability to establish a meaningful average, thereby influencing its predictive reliability.
Usage Instructions
The SPI Change API facilitates the retrieval of data on how often dry or wet periods might become more frequent or less frequent in the future.
Inputs
To interact with the SPI Change API, the following input parameters must be provided:
-
precip_stress_type: Choose betweendryorwetto evaluate the nature of the precipitation stress. This input is critical to tailor your analysis for specific drought or wetness conditions. -
latitude&longitude: The geographical coordinates in decimal degrees where the analysis is desired. Latitude ranges from -90 to 90, and longitude from -180 to 180. NOTE: please check our available geographical region page here to ensure the index is available in your desired region. -
period: Specify the duration for your projection analysis. Format your input asYYYY_YYYY(e.g., 2020_2050). Available options include: 2020_2050, 2030_2060, 2040_2070, 2050_2080, 2060_2090, and 2070_2100. -
model: The climate model used for analysis. Our database is updated periodically with new models. If your preferred model is not listed, please contact us for assistance.
Interactive Endpoint
You can access and interact with the API endpoints using our API Endpoint Directory.
Use Case: Change of Drought Conditions over Zurich, Switzerland
The JSON output below encapsulates the findings from the SPI API, highlighting the expected shifts in dry (drought) conditions within the specified geographic coordinates over a future time period. The metadata section conveys the essentials of the data generation, such as the utilized climate model, the type of precipitation stress analyzed (dry in this case), and the precise location coordinates. The analysis section then breaks down the expected monthly frequency of various drought intensities by comparing the historical data with future projections.
Example API Output:
{
  "metadata": {
    "generated_at": "2023-11-03T10:18:29.504288+00:00",
    "model": "cmip6_ec_earth3_cc",
    "stress_type": "dry",
    "location": {
      "latitude": 44,
      "longitude": 5
    },
    "projection_timeperiod": "2060_2090"
  },
  "analysis": {
    "month_per_year": {
      "historical": {
        "moderate": 0.918,
        "severe": 0.4426,
        "extreme": 0.3934
      },
      "ssp2_4_5": {
        "moderate": 1.129,
        "severe": 0.5806,
        "extreme": 0.3226
      },
      "ssp5_8_5": {
        "moderate": 1.2258,
        "severe": 0.7097,
        "extreme": 0.5806
      }
    },
    "absolute_change": {
      "ssp2_4_5": {
        "moderate": 0.211,
        "severe": 0.138,
        "extreme": -0.0709
      },
      "ssp5_8_5": {
        "moderate": 0.3078,
        "severe": 0.2671,
        "extreme": 0.1872
      }
    },
    "percent_change": {
      "ssp2_4_5": {
        "moderate": 22.9839,
        "severe": 31.1828,
        "extreme": -18.0108
      },
      "ssp5_8_5": {
        "moderate": 33.5253,
        "severe": 60.3345,
        "extreme": 47.5806
      }
    }
  }
}
How to Interpret This Information:
The data represents a location at 44°N latitude and 5°E longitude and analyzes patterns of dry conditions using the EC Earth3 CC climate model. The figures compare historical averages with projections for the period 2060-2090. The month_per_year indicates the historical average number of months experiencing moderate, severe, or extreme drought conditions, and projects these averages into future scenarios SSP 2.4.5 and SSP 5.8.5. The absolute_change and percent_change provide insights into how these averages may alter in the future (always in reference to historical period), both in absolute terms and percentage differences.
Takeaways from our Specific Example:
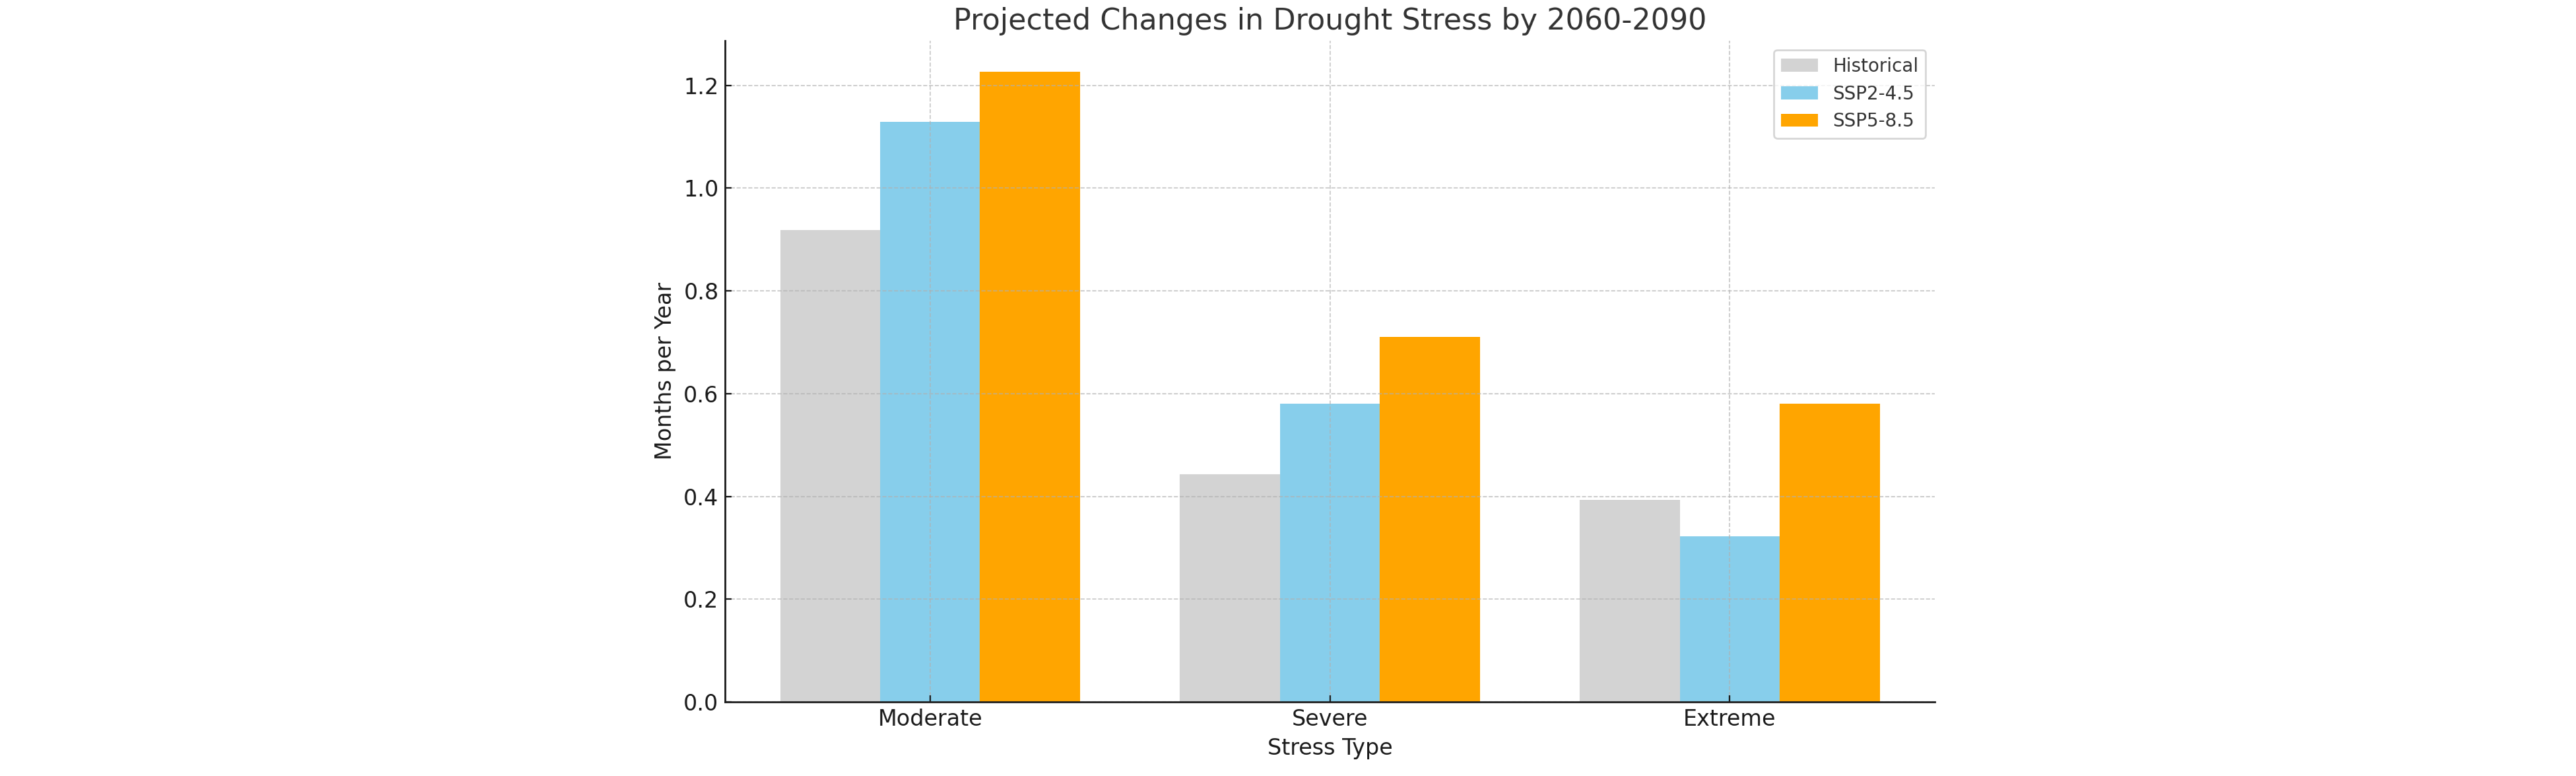
Historically, per year, the location experienced moderate drought conditions for approximately 0.92 months, severe conditions for 0.44 months, and extreme conditions for 0.39 months.
Under the SSP 2.4.5 scenario, a mid-range emission pathway, this may change to 1.13 months of moderate drought, 0.58 months of severe, and a decrease to 0.32 months of extreme drought conditions.
For the high-end emission scenario SSP 5.8.5, these projections increase to 1.23 months for moderate, 0.71 months for severe, and 0.58 months for extreme drought conditions annually.
This translates to a 22.98% increase for moderate, 31.18% for severe, and an 18.01% decrease for extreme drought conditions under SSP 2.4.5; and a 33.53% increase for moderate, 60.33% for severe, and a significant 47.58% increase for extreme drought conditions under SSP 5.8.5, compared to historical data.
Interpreting these changes requires careful consideration of the uncertainties inherent in climate projections. For a comprehensive understanding, comparing multiple models and emission scenarios is crucial. It's important to keep abreast of the latest scientific literature and reports for up-to-date information and to understand the broader implications of these projections for water resource management and planning.
In regions where observed trends in precipitation are not pronounced, it is important to exercise caution when projecting the impacts of future CO2 scenarios. Higher CO2 levels do not automatically translate to more extreme changes in precipitation, particularly when such projections are derived from a single climate model. This caution is advised because individual models may not fully capture the intricate and region-specific responses of the climate system to increased CO2 concentrations. Users should consider the potential for non-linearities, model sensitivity variances, and natural climatic variability, which all contribute to the uncertainty of regional precipitation projections under different greenhouse gas emission scenarios.
References and Further Reading:
For a thorough understanding of the index methodology, please consult the key publication:
-
McKee, Thomas B., Nolan J. Doesken, and John Kleist. "The relationship of drought frequency and duration to time scales." Proceedings of the 8th Conference on Applied Climatology. Vol. 17. No. 22. 1993. Access the paper.