Heat & Cold Wave Index
The heat and cold wave Index API offers a straightforward metric for understanding the potential future of heatwaves and coldwaves up to the year 2100 (historical reanalsysis coming soon!). Utilizing a methodology based on Russo et al. (2023), it helps to quantify heatwave intensity and frequency, providing valuable insights for planning and adaptation strategies.
Our API adopts a unique 30-day rolling window approach, allowing for a refined analysis of heatwave patterns. This method captures inter-annual variability and enables a deeper statistical examination, comparing each day against a historical baseline of the same period across multiple years. This granularity ensures that our metric is not only robust but also highly informative for diverse applications. See more details in the Methodology section.
Index Creation Methodology
Our methodology for calculating the Heatwave Index is multifaceted and designed to be both accurate and relevant to contemporary climatic conditions. Explore our methodology in greater detail by navigating through the tabs below:
📊 Detailed Breakdown: Understanding Our Heatwave Index Calculations
Temporal Resolution and Averages
- Daily Averages: Our index is based on daily average temperatures, not just daily extremes, to fully represent the temperature conditions.
Rolling Averages and Trends
- 30-Day Rolling Average: We apply a 30-day rolling average to daily temperatures to discern longer-term climatic patterns and mitigate the effect of short-term anomalies.
Defining Heatwaves
- Threshold Determination: Heatwaves are identified when temperatures top the 90th percentile of a historical 30-day rolling maximum, using reference records that span 1950 to 2010.
- Heatwave Duration: A heatwave is recorded when there's a minimum three-day span with temperatures exceeding our established threshold.
Usage Instructions
The Heatwave Index API provides endpoints for retrieving data on heatwave occurrences and intensities. Below are the instructions on how to make requests to the API.
Inputs
The API accepts the following parameters:
-
wave_type: The type of wave frequency data to analyze (heatfor heat waves,coldfor cold waves). -
start&end: The analysis timeframe in years (YYYY). For example, from 2050 to 2080. The acceptable range is from 2015 to 2100. The minimum difference between the start and end is 10 years, while the maximum is 30 years. -
latitude&longitude: The geographical coordinates in decimal degrees where the analysis is desired. Latitude ranges from -90 to 90, and longitude from -180 to 180. NOTE: please check our available geographical region page here to ensure the index is available in your desired region. -
model: The climate model used for analysis. Our database is updated periodically with new models. If your preferred model is not listed, please contact us for assistance.
Interactive Endpoint
You can access and interact with the API endpoints using our API Endpoint Directory.
Use Case: Change of Heatwave Frequency over Switzerland
The JSON structure below represents the output provided by the Heatwave Index API, detailing the expected changes in heatwave characteristics due to climate change. The metadata block offers information about the data generation, including the climate model, type of wave analyzed, and the specific location. The analysis block presents a comprehensive view of the projected changes in heatwave events by comparing historical data with future scenarios.
Example API Output:
{
  "metadata": {
    "generated_at": "2023-11-03T10:18:29.504288+00:00",
    "model": "cmip6_ec_earth3_cc",
    "wave_type": "heat",
    "location": {
      "latitude": 42,
      "longitude": 5
    },
    "projection_timeperiod": {
      "start_year": 2045,
      "end_year": 2075
    }
  },
  "analysis": {
    "average_absolute_values": {
      "event_duration": {
        "historical": 5.0639,
        "ssp_2_4_5": 7.442,
        "ssp_5_8_5": 9.3605
      },
      "longest_event_duration": {
        "historical": 8.1887,
        "ssp_2_4_5": 22.6774,
        "ssp_5_8_5": 39
      },
      "number_of_events_per_year": {
        "historical": 3.9057,
        "ssp_2_4_5": 16.4194,
        "ssp_5_8_5": 16.8065
      }
    },
    "absolute_change": {
      "event_duration": {
        "ssp_2_4_5": 2.3781,
        "ssp_5_8_5": 4.2967
      },
      "longest_event_duration": {
        "ssp_2_4_5": 14.4887,
        "ssp_5_8_5": 30.8113
      },
      "number_of_events_per_year": {
        "ssp_2_4_5": 12.5137,
        "ssp_5_8_5": 12.9008
      }
    },
    "percent_change": {
      "event_duration": {
        "ssp_2_4_5": 46.9622,
        "ssp_5_8_5": 84.8496
      },
      "longest_event_duration": {
        "ssp_2_4_5": 176.9362,
        "ssp_5_8_5": 376.2673
      },
      "number_of_events_per_year": {
        "ssp_2_4_5": 320.3989,
        "ssp_5_8_5": 330.3101
      }
    }
  }
}
How to Interpret This Information:
The example presents data for the location at 42°N latitude and 5°E longitude, focusing on heatwave patterns using the EC Earth3 CC climate model. Each query provides three data sets: a historical representation (based on models from 1950 to 2010) and projections for two different climate scenarios. We compare average data from a historical period with projections for 2045-2075. The average_absolute_values show metrics that quantify (1) the typical duration of a heatwave (in days per year), (2) the length of the longest heatwave each year (in days per year), and (3) the average number of heatwave events annually (in events per year). This example includes historical data and two projection scenarios (SSP245 and SSP585). Additionally, changes between the historical and projected periods are provided in absolute numbers and as a percentage (absolute_change and percent_change).
Takeaways from our Specific Example:
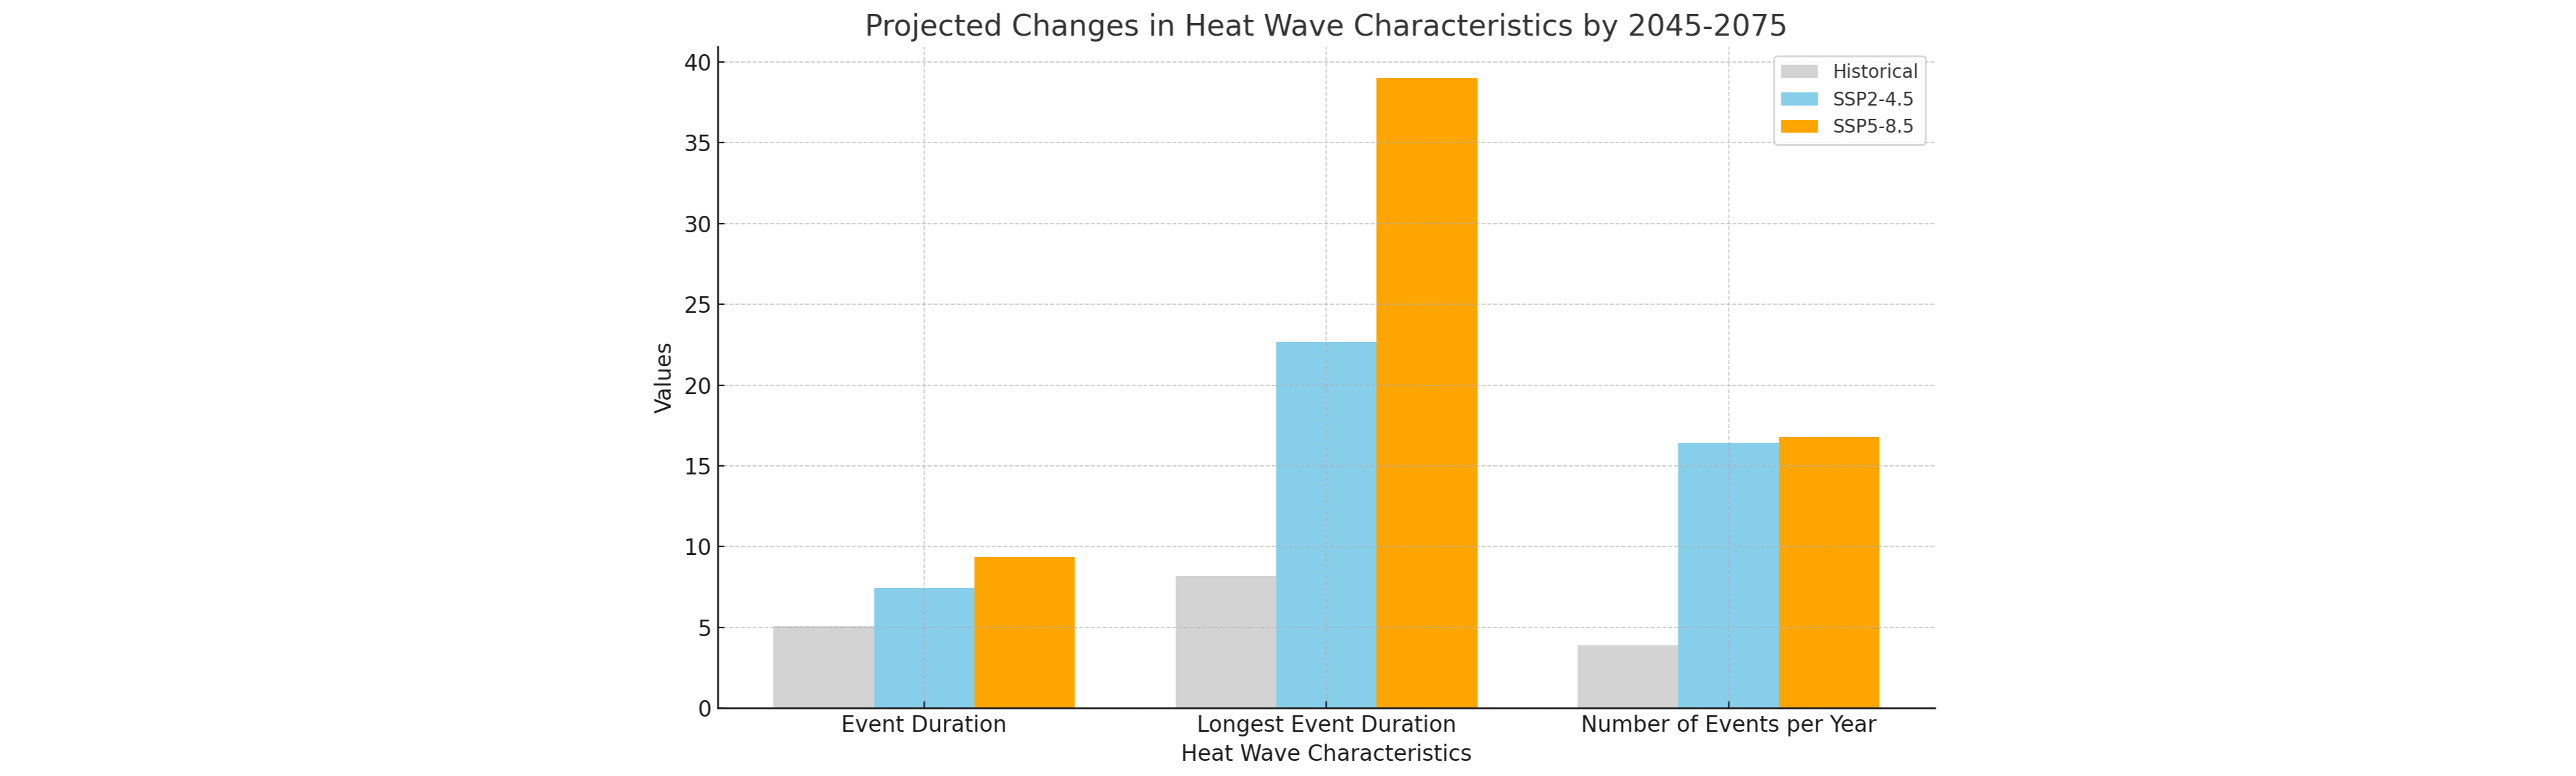
Historically, an average heatwave lasted about 5.06 days, the longest annual event stretched to 8.19 days, and there were roughly 3.9 heatwave events per year (refer to Nature Paper for observed comparisons, particularly Figure 1). Under the SSP585 scenario (considered a high-end emission trajectory read more here), an average heatwave may last 9.36 days, with the longest events reaching up to 39 days, and an increase to about 16.80 events annually. These figures translate to an 84% increase in average event duration, a 376% increase in the longest event duration, and a 330% increase in the annual number of events by 2045-2075 compared to the historical period.
It's important to consider multiple models for a comprehensive understanding due to inherent uncertainties in climate modeling, and ClimaLinks aims to expand its model offerings to facilitate this. For a broader perspective on heatwaves, the Nature Reviews Paper is an excellent resource.
References
For a thorough understanding of the Heatwave Index methodology, please consult the key publication:
- Russo, S., et al. (2023). "Increasing Intensity of Extreme Heatwaves: The Crucial Role of Metrics." Geophysical Research Letters. Access the paper.